
Figure 1. Callosal Inputs Evoke Stronger Excitation and Inhibition at L5 CT Neurons.
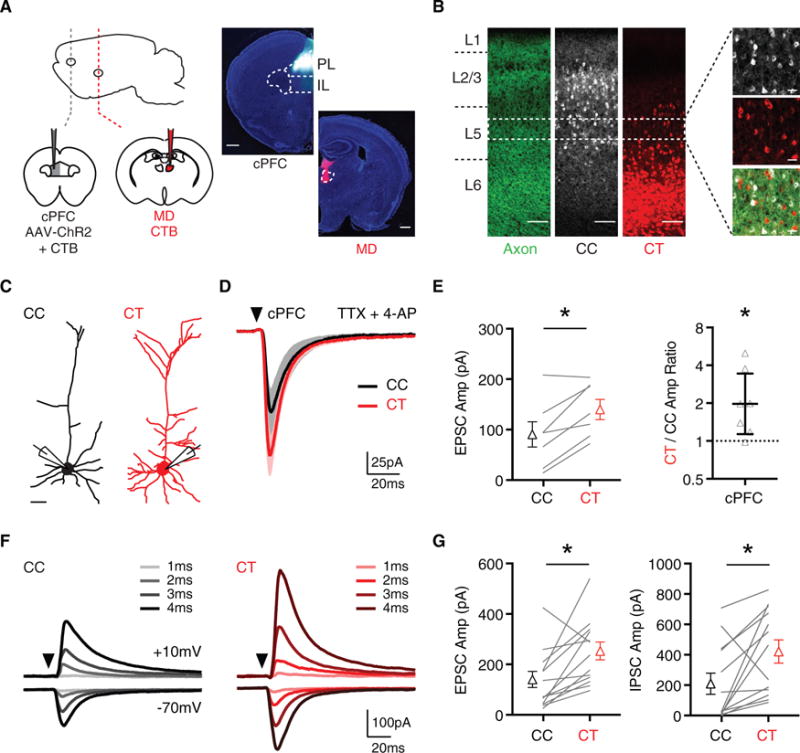
(A) Left, injections of AAV-ChR2 into the contralateral PFC (cPFC) to label callosal inputs, and CTB into the cPFC or ipsilateral mediodorsal thalamus (MD) to label CC and CT neurons. Right, injection sites, with dashed regions indicating prelimbic (PL), infralimbic (IL), and MD (scale bar, 500 μm). (Representative images, n = 3 mice.)
(B) Confocal images showing the distributions of cPFC axons (left), CC neurons (middle), and CT neurons (right) across multiple layers of PL PFC (scale bar, 100 μm). Dashed white box indicates the band in layer 5 (L5) from which electrophysiological recordings were made. Far right, confocal images of CC neurons (white) CT neurons (red) and intermingled cPFC axons (green) (scale bar, 25 μm).
(C) Morphological reconstructions made from 2-photon images of CC neurons (black) and CT neurons (red) (scale bar, 50 μm).
(D) Average monosynaptic cPFC-evoked EPSCs at pairs of CC (black) and CT (red) neurons recorded in the presence of TTX and 4-AP (n = 7 pairs, 4 mice). Arrow indicates light pulse (4-ms duration).
(E) Summary of EPSC amplitudes at pairs of CC and CT neurons (left) and CT/CC amplitude ratio with y axis on log2 scale (right).
(F) Average cPFC-evoked EPSCs recorded at −70 mV and IPSCs recorded at +10 mV in CC (black) and CT (red) neurons, recorded across a range of light durations (1–4 ms) in the absence of TTX and 4-AP (n = 13 pairs, 8 mice). Traces are averages taken across all cells at each LED pulse duration.
(G) Summary of amplitudes of EPSCs (left) and IPSCs (right) recorded at pairs of CC and CT neurons in response to 4 ms light stimulation.
See also Figure S1. Values are mean ± SEM (E, left and G) or geometric mean ± CI (E, right), *p < 0.05.