
Figure 2. Both PV+ and SOM+ Interneurons Are Engaged by Callosal Inputs.
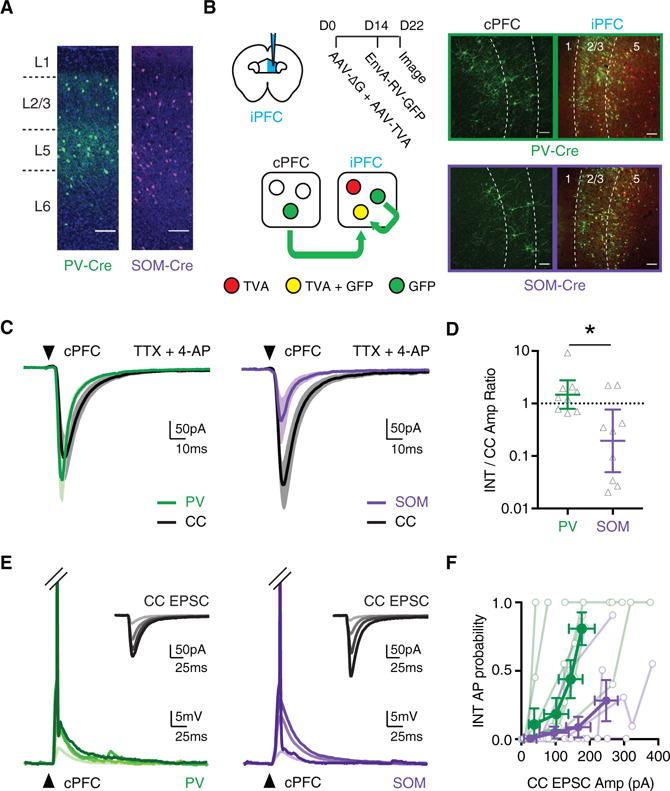
(A) Distributions of PV+ (green) and SOM+ (purple) interneurons across multiple layers of prelimbic PFC, in virally injected PV-Cre and SOM-Cre mice (scale bars, 100 μm). (Representative images, n = 3 mice each for PV- and SOM-Cre.)
(B) Left, schematic of conditional rabies virus (RV) tracing, with helper AAVs injected on day 0 and RV on day 14 in the ipsilateral PFC (iPFC), followed by imaging on day 22 in the iPFC and cPFC. Right, representative anatomy for PV-Cre (top) and SOM-Cre (bottom) mice (n = 3 mice each for PV- and SOM-Cre), showing TVA+ interneurons in the iPFC (red), starter interneurons in the iPFC (yellow), and connected presynaptic neurons in the iPFC and cPFC (green) (scale bar, 100 μm).
(C) Average cPFC-evoked EPSCs at pairs of CC neurons (black) and neighboring PV+ interneurons (green) (n = 9 pairs, 4 mice) or SOM+ interneurons (purple) (n = 9 pairs, 4 mice). Arrow indicates light pulse (4-ms duration).
(D) Summary of interneuron (INT)/CC amplitude ratio from recordings in (C), with y axis on log10 scale.
(E) cPFC-evoked EPSPs and action potentials (APs) at PV+ (green) and SOM+ (purple) interneurons, recorded across a range of light durations (n = 9 pairs, 5 mice for PV+, n = 7 pairs, 4 mice for SOM+). APs have been truncated to highlight subthreshold responses. Arrows indicate light pulse. Insets show average cPFC-evoked EPSCs at adjacent CC neurons (black). Responses shown at a range of light durations (1–4 ms), evoking cPFC input of increasing magnitude. Darker lines represent longer pulse durations.
(F) Summary of AP probability at PV+ and SOM+ interneurons as a function of EPSC amplitude at adjacent CC neurons. Data are shown across increasing light durations (1–4 ms), with each cell contributing 4 data points.
See also Figure S2. Values are geometric mean ± CI (D) or mean ± SEM (F), *p < 0.05.