
Figure 7. Targeted Inhibition Dampens EPSPs and Suppresses AP Firing.
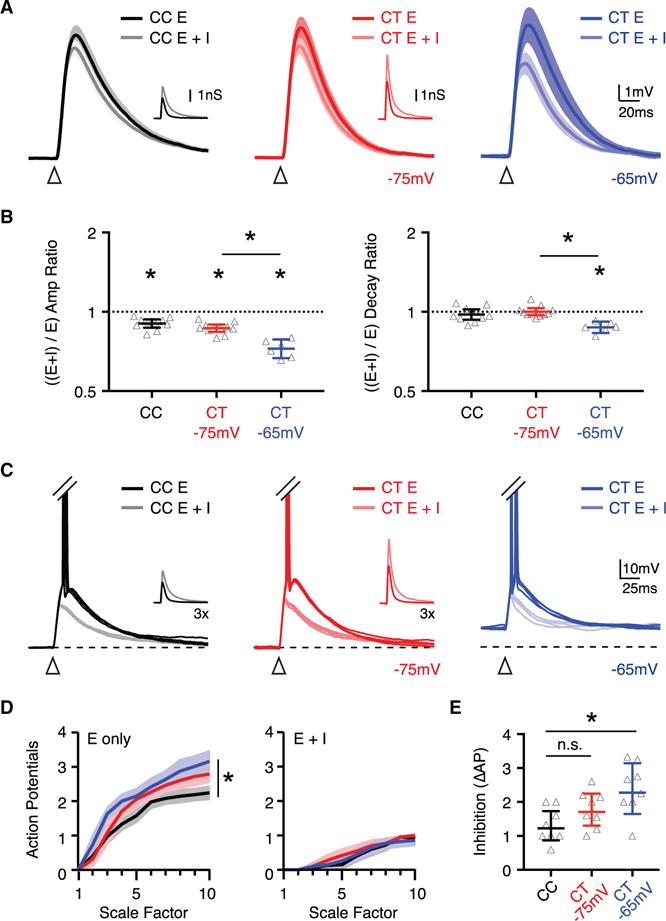
(A) Average conductance-evoked EPSPs recorded in dynamic clamp at CC neurons held at −75 mV (left) (n = 10 neurons) and CT neurons held at either −75 mV (middle) (n = 11 neurons) or −65 mV (right) (n = 6 of the 11 neurons recorded at −75 mV) (n = 6 mice total). Traces show response to either excitation alone (E) or excitation and inhibition (E + I). Inset traces show injected conductances, where dark traces are excitation and light traces are inhibition. Arrows indicate conductance onset.
(B) Summary of ([E + I] / E) amplitude (left) and decay (right) ratios, with y axis on log2 scale.
(C) Suprathreshold responses recorded in dynamic clamp, where APs have been truncated to highlight subthreshold responses. Inset traces show injected conductances with 3× scale factor.
(D) Summary of number of APs evoked at CC (n = 8 neurons) and CT (n = 8 neurons) neurons in response to different scale factors of excitation alone (left) or excitation and inhibition (right) (n = 4 mice total).
(E) Summary of inhibition of firing, calculated as the difference (Δ) in APs evoked by excitation alone (E) or excitation and inhibition (E + I) at the 10× scale factor.
See also Figures S6 and S7. Values are geometric mean ± CI (B) or mean ± SEM (D and E), *p < 0.05.