
Fig. 7.
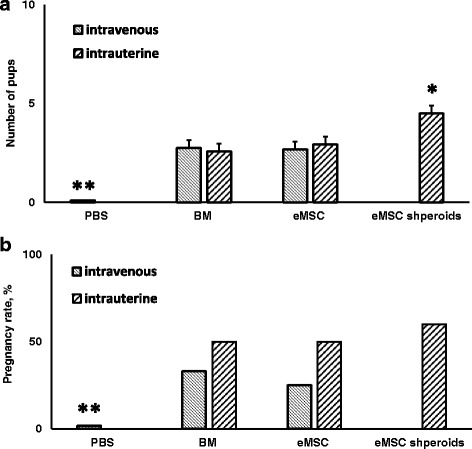
Number of pups (a) and pregnancy rate (b) in rats with modeled AS after intravenous or intrauterine transplantation of eMSC and rat BM. a **p < 0.01, animals received intravenous or intrauterine cell transplantation vs. PBS; *p < 0.01, eMSC spheroids vs. BM or monolayer eMSC transplantation. (Kruskal-Wallis H-test followed by Mann-Whitney U test with Bonferroni correction). b **p < 0.05, animals received intravenous or intrauterine cell transplantation vs. PBS. (Fisher’s exact test). BM rat bone marrow, eMSC endometrial mesenchymal stem cells