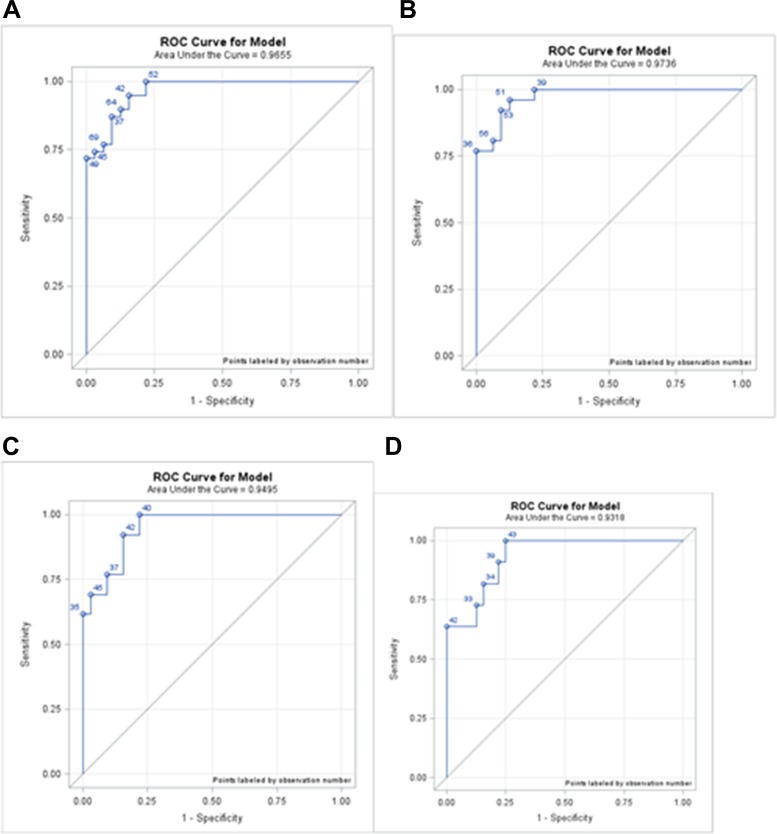
Figure 2. ROC curves for each phase.
(A) ROC curve of healthy subjects vs. IM, HGD, and LGD; AUC was 0.9655. (B) ROC curve of healthy subjects vs. IM; AUC was 0.9736. (C) ROC curve of healthy subjects vs. LGD and HGD; AUC was 0.9495. (D) ROC curve of healthy subjects vs. EC; AUC was 0.9318. IM: intestinal metaplasia; LGD: low-grade dysplasia; HGD: high-grade dysplasia; EC: early cancer.

