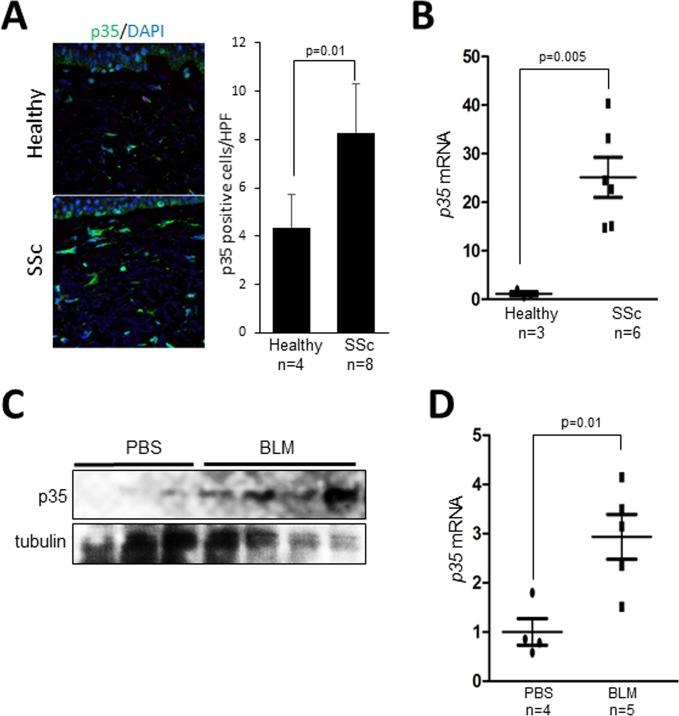
Figure 1. Elevated p35 expression in SSc skin biopsies.
(A) Immunofluorescence. Skin biopsies from SSc patients (n = 8) and healthy controls (n = 4) were immunostained with anti-p35 antibodies (green); nuclei were identified using DAPI (blue). Left panel, representative images; bar=20 μm. Right panels, quantitation of p35+ cells. Results are mean ± SEM; *p < 0.05. (B) Real-time qPCR. RNA from healthy (n = 3) and SSc (n = 6) fibroblasts Results, normalized to GAPDH, represent mean of triplicate determinations from each cell line. *p < 0.05. (C, D) p35 levels in bleomycin-induced SSc. Mice were given s.c. injections of bleomycin (n = 4-5) or PBS (n = 3-4) daily for 14 consecutive days, sacrificed on day 28, and skin harvested for Western analysis (C) and real-time qPCR; results, normalized to 36B4, are means ± SD of triplicate determinations from each skin biopsy. *p < 0.05. BLM, bleomycin. Scale bar, 20 μm.

