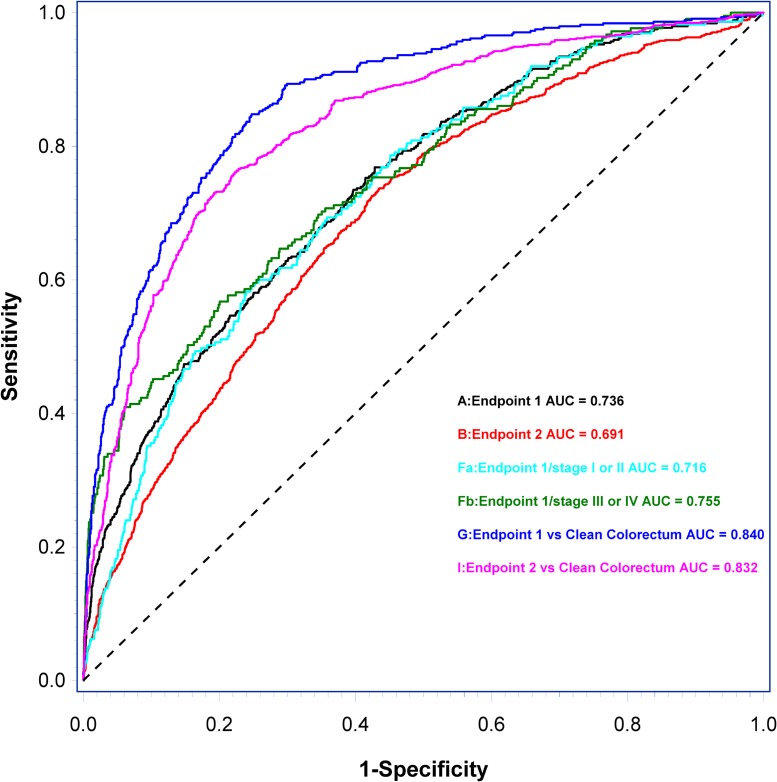
Figure 4.
Receiver operating characteristic (ROC) curves and area under the ROC curve (AUCROC) of predictor models and subgroup-predictor models based on the discrimination of endpoint 1 (A), endpoint 2 (B), the discrimination of early stage CRC (Fa) and late stage CRC (Fb) from individuals with non-malignant findings, the discrimination of individuals with CRC (G) from individuals with clean colorectum, and the discrimination of individuals with CRC and high risk adenomas (I) from individuals with clean colorectum. Letters in parenthesis refer to results from Predictor models listed in Table 3.

