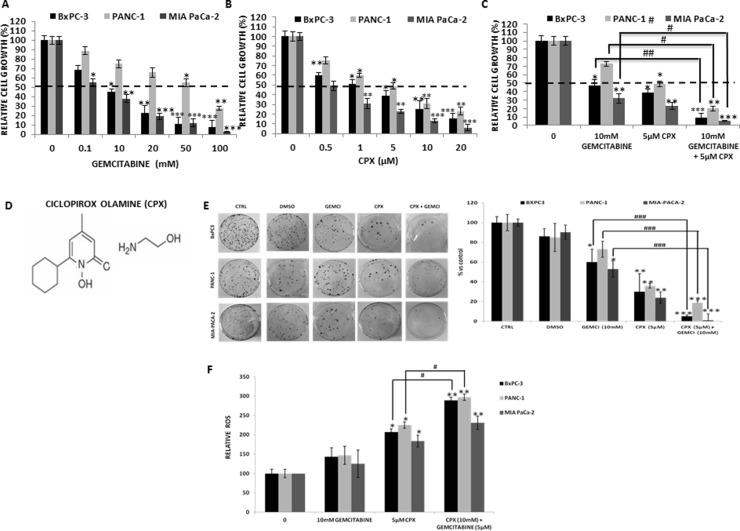
Figure 1. CPX showed higher inhibitory effects on cell proliferation and colony forming ability as well as further stimulation of the ROS generation compared to gemcitabine treatment, in human pancreatic cell lines.
BxPC-3, PANC-1 and MIA-PaCa-2 cells were incubated with a range of (A) CPX increasing doses (0 −20 μM) and (B) Gemcitabine increasing doses (0 – 100 mM). Next, cell viability was analyzed using colorimetric MTT metabolic activity assay. (C) Cells were exposed to gemcitabine co-incubated with CPX, at concentration 10 mM and 5 μM respectively, and were analyzed using colorimetric MTT metabolic activity assay. (D) Chemical structure of CPX (ciclopirox olamine). (E) Clonogenic survival of BxPC-3, PANC-1 and MIA-PaCa-2 following exposure to gemcitabine (10 mM) and CPX (5 μM) singly or in combination. Results are expressed as percentages vs controls and shown adjacent to representative petri dishes. Average values of three experiments ±S.D. (n = 3) are shown. *P < 0.05; **P < 0.01; ***P < 0.001; difference vs control group, #P < 0.05; ##P < 0.01; ###P < 0.001; difference vs gemcitabine group. (F) BxPC-3, PANC- 1 and MIA-PaCa-2 cells were pre-incubated with 5 μM CPX and/or 10 mM gemcitabine for 4 hours to assess ROS production. Here we show results obtained by OHdG measurements. Absorbance detection was measured using a microplate reader * P < 0.05, **P < 0.01 vs. control group. #, P<0.05 vs.CPX group, (Student's t-test). All values are expressed as average ±S.D. (n = 3). Gemci; Gemcitabine.

