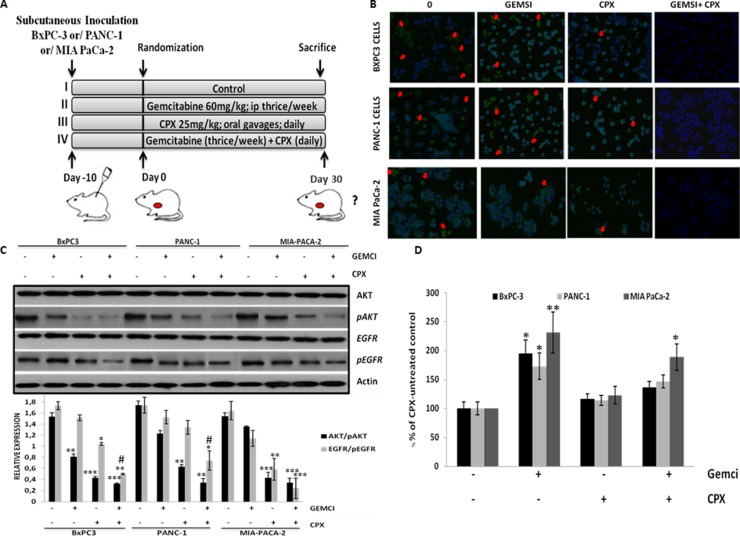
Figure 6. CPX monotherapy reduces cell proliferation levels, decreases pEFGR (Y1068) and pAKT (S473) levels in tumor cells more robustly in comparison with gemcitabine, however, abolishes gemcitabine-induced ROS levels in pancreatic tissues, in vivo.
(A) Schematic representation of the experiment protocol; SCID mice bearing subcutaneous BxPC-3 Panc1 and MIA PaCa-2 tumor xenografts, were grouped into four groups, respectively (i) vehicle (n = 6); (ii) Gemcitabine alone (60 mg/kg) (n = 6); (iii) CPX alone (25 mg/kg) (n = 6);; (iv) Combination of gemcitabine (60mg/kg) and CPX (25 mg/kg) (n = 6);. (B) Representative images of Ki67-positive cells in tumor tissues from BxPC-3 Panc1 and MIA PaCa-2 tumor xenografts, on day 30 after treatment initiation, were assessed by confocal fluorescence microscopy. Red arrows indicate Ki67-positive cells (C) Mice were treated as described in Figure 6A. Tumors were harvested on day 30 of treatment for immunoblotting (three pooled samples per treatment / cell line for the experiment described in (A) and the indicated total and phosphorylated proteins were estimated by Western blot analysis of three independent experiments with similar results. (D) The levels of 8-hydroxy-2’ -deoxyguanosine (8-OHdG0 (arbitrary units, AU) were verified in the pancreatic tissues of BxPc3, Panc1 and MIA PaCa-2 tumor xenograft models, mice, respectively, treated with CPX and/or gemcitabine on day 30 as indicated in Figure 6A. (n = 6 per experimental group). *P < 0.05 (Student's t-test). All values are expressed as average ± S.D. CTR, vehicle control; Gemci, Gemcitabine; CPX, ciclopirox.

