
Fig. 3.
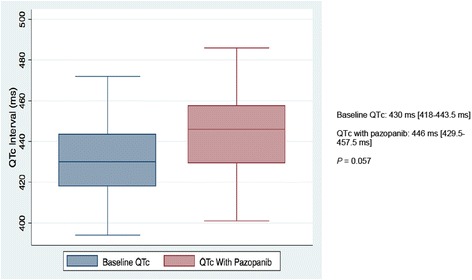
Comparison of median corrected QT intervals in 24 patients with electrocardiograms at baseline and after pazopanib initiation
Line in each box represents the median while boxes represent the interquartile range. QTc values on the right represented as median [1st quartile-3rd quartile]. P-value obtained from match-paired Wilcoxon test (N = 24) assuming P < 0.05 represents significance. QTc: corrected QT interval; ms: milliseconds