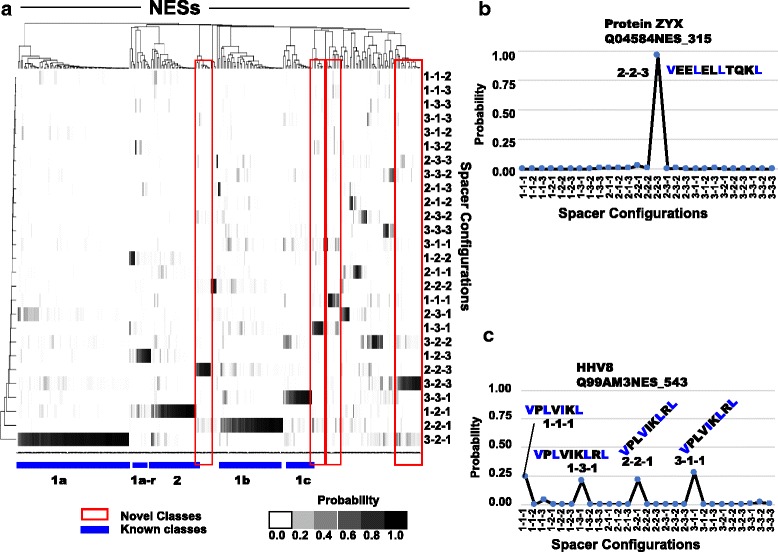
Fig. 5.

Clustering of NESdb identifies known and novel classes. a Posterior probabilities of NES configurations are indicated in a heat map, where black corresponds to higher probabilities. Two hundred seventy-nine NESs have been clustered based on similarity, while configurations are ordered from most populated to least (bottom to top). Clusters corresponding to previously known classes of NESs are indicated as blue lines, while novel classes are indicated as red boxes. b shows an example of a high scoring NES that clearly matches unknown or undescribed class of spacing configuration 2–2-3. c shows an example of an NES that shares equal probability (approximately 0.2) in 4 different classes of spacing configurations; 3 Novel (1–1-1, 1–3-1, and 3–1-1) and 1 of the canonical classes (2–2-1)
