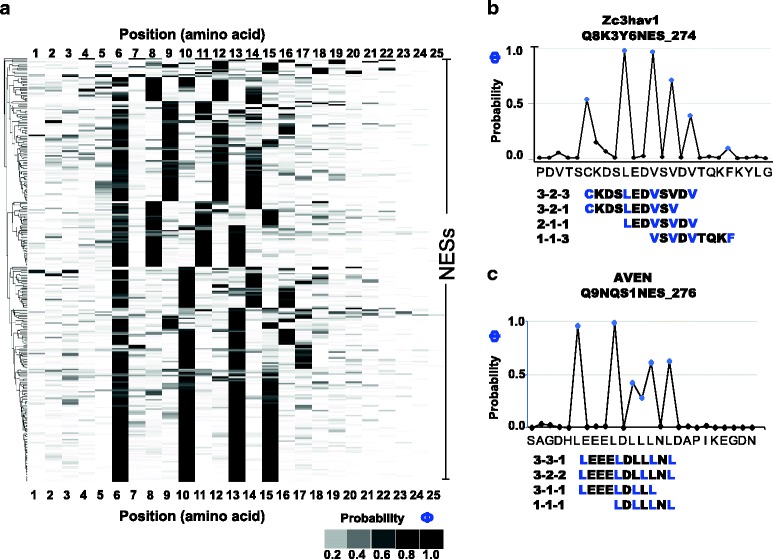
Fig. 6.

Clustered heat maps of the posterior probabilities of being a hydrophobic position within each of the subset of NESdb NESs analyzed as the 25amino acid peptide window. Panel (a) The columns represent the amino acid position and the rows of the heat map represent the individual NESs. The legend shows the grey scale intensity with corresponding probability for the heat map. Panel (b) and (c) Shows two example NESs with plots of the posterior probability of being a hydrophobic position for each of the residues in the 25-amino acid window. Also included are the possible configurations that can be assumed using different combinations of the most probable hydrophobic residues
