Fig. 1.

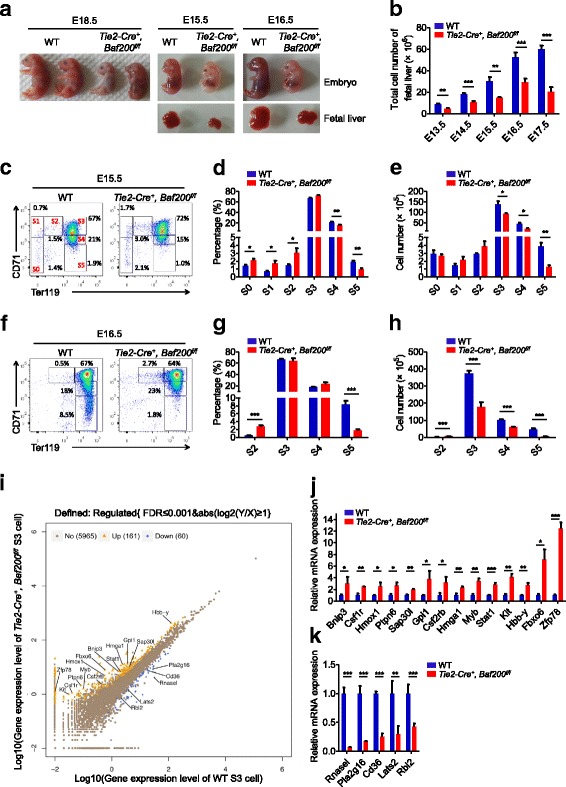
Tie2-Cre+, Baf200f/f mice display embryonic lethality with defective fetal erythropoiesis. a Representative photographs of embryos and FLs from Tie2-Cre+, Baf200f/f mice and WT littermate at E15.5, E16.5, and E18.5. b Absolute cell number of FLs from Tie2-Cre+, Baf200f/f embryos and WT littermate at different developmental stages (n = 5–13 per genotype for each stages). c FACS profiles of CD71/Ter119 erythroid subsets in the FLs from E15.5 Tie2-Cre+, Baf200f/f embryos and WT littermates. d, e Percentage (d) and absolute cell number (e) of CD71/Ter119 erythroid subsets from E15.5 Tie2-Cre+, Baf200f/f embryos and WT littermates (n = 4 per genotype). f FACS profiles of CD71/Ter119 erythroid subsets in the FLs from E16.5 Tie2-Cre+, Baf200f/f embryos and WT littermates. g, h Percentage (g) and absolute cell number (h) of CD71/Ter119 erythroid subsets from E16.5 Tie2-Cre+, Baf200f/f embryos and WT littermates (n = 4 per genotype). i Scatter plots of all expressed genes in S3 cells from WT and Tie2-Cre+, Baf200f/f FLs. Blue indicates downregulation gene, yellow indicates upregulation gene, and gray indicates non-regulation gene in Tie2-Cre+, Baf200f/f S3 cells. j, k Upregulation genes (j) and downregulation genes (k) in Tie2-Cre+, Baf200f/f S3 cells were confirmed by RT-qPCR (n = 3 per genotype). Data are shown as means ± SEM. *P < 0.05; **P < 0.01; ***P < 0.001
