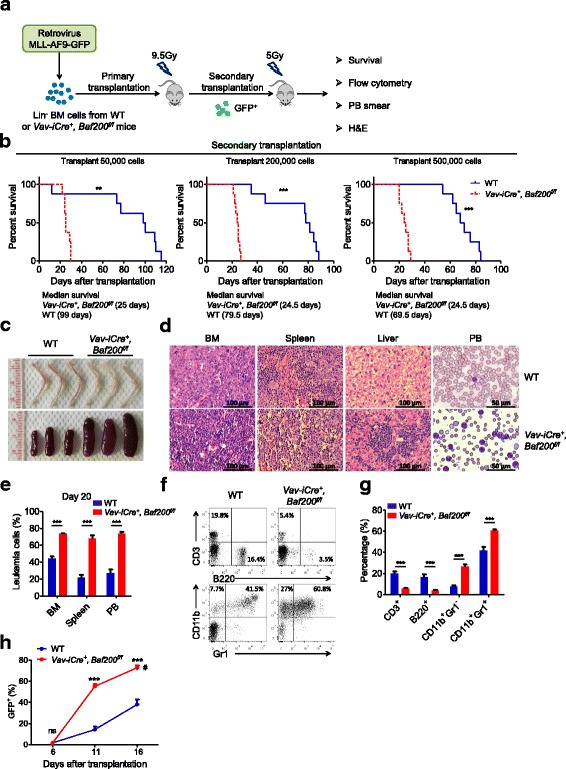
Fig. 7.

Loss of Baf200 accelerates leukemogenesis in MLL-AF9-induced AML. a Scheme to investigate the role of endogenous Baf200 in MLL-AF9-induced AML. b Survival curve of recipient mice engrafted with leukemia cells from primary recipients in the secondary transplantation assay (n = 8 per genotype). c Representative photos of bone and spleen from recipient mice. d Histology of the BM, spleen, and liver and blood smear from recipients. e Graph showing the percentage of leukemia cells in the BM (n = 3 per genotype), spleen (n = 3 per genotype), and PB (peripheral blood) (n = 8 per genotype) from recipient mice. f Representative flow profiles of myeloid and lymphoid subsets in the PB from recipients. g Graph showing the percentage of the indicated subsets in the PB (n = 8 per genotype for each subset). h Graph showing the percentage of leukemia cells (GFP+) in the PB from recipients at indicated days post-transplantation (n = 5 per genotype for each subset). Vav-iCre+, Baf200f/f group mice showed accelerated accumulation of leukemia cells in the PB. The number sign indicates Vav-iCre+, Baf200f/f group mice started to die at 16 days post-transplantation. Data are shown as means ± SEM. **P < 0.01; ***P < 0.001
