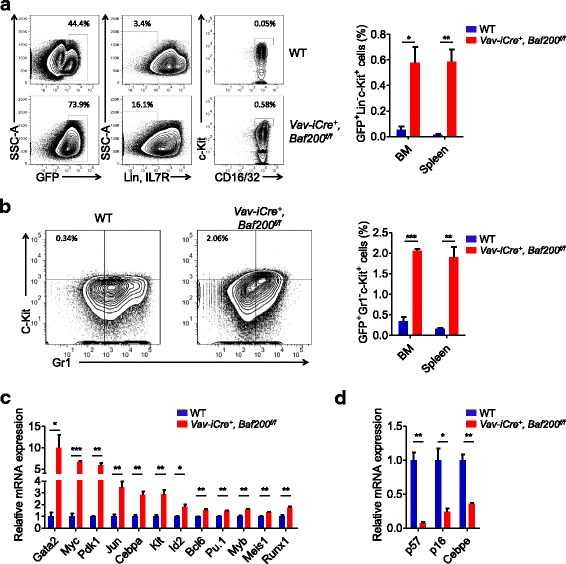
Fig. 8.

Increased percentage of LSCs in Baf200-deficient AML. a The flow profiles (left) and graph (right) showing the percentage of LSCs (GFP+Lin−c-Kit+) in the BM from recipients (n = 3 per genotype). b The flow profiles (left) and graph (right) showing the percentage of GFP+Gr1−c-Kit+ subset in the BM from recipients (n = 3 per genotype). c, d Upregulation (c) and downregulation (d) genes in Vav-iCre+, Baf200f/f leukemia cells (n = 3 per genotype). Data are shown as means ± SEM. *P < 0.05; **P < 0.01; ***P < 0.001
