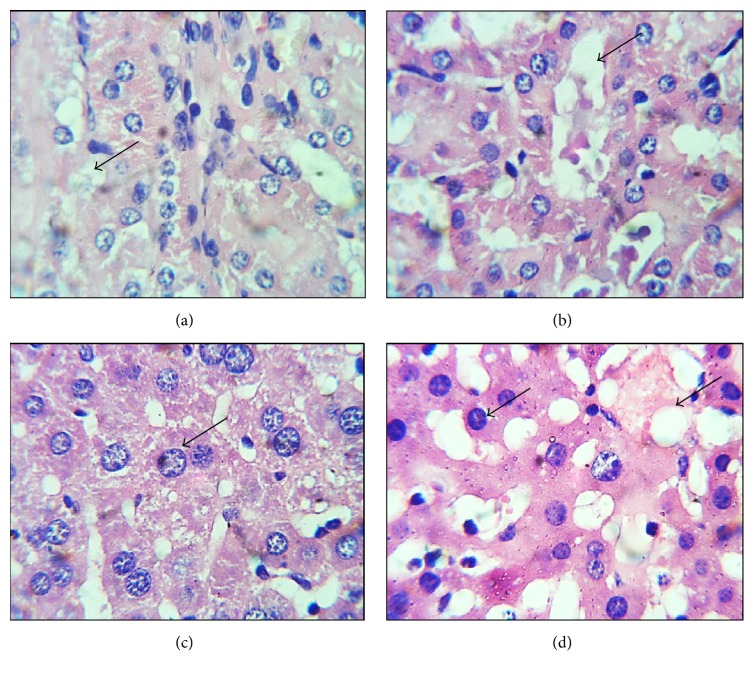
Figure 1.
Comparison of photomicrographs of liver and kidney sections of animals exposed at 1500 mg/kg of mixture of extracts and control. (a) Control kidney section showed normal nucleus in lymphocytes and vacuoles are small in size. (b) Treated kidney showed slight abnormality in kidney, vacuole, and deformed nucleus can be observed. (c) Control liver section exhibited normal hepatocyte nuclei and intracellular spaces. (d) Treated liver revealed abnormalities in hepatocyte nucleus and large vacuoles indicated by arrows.

