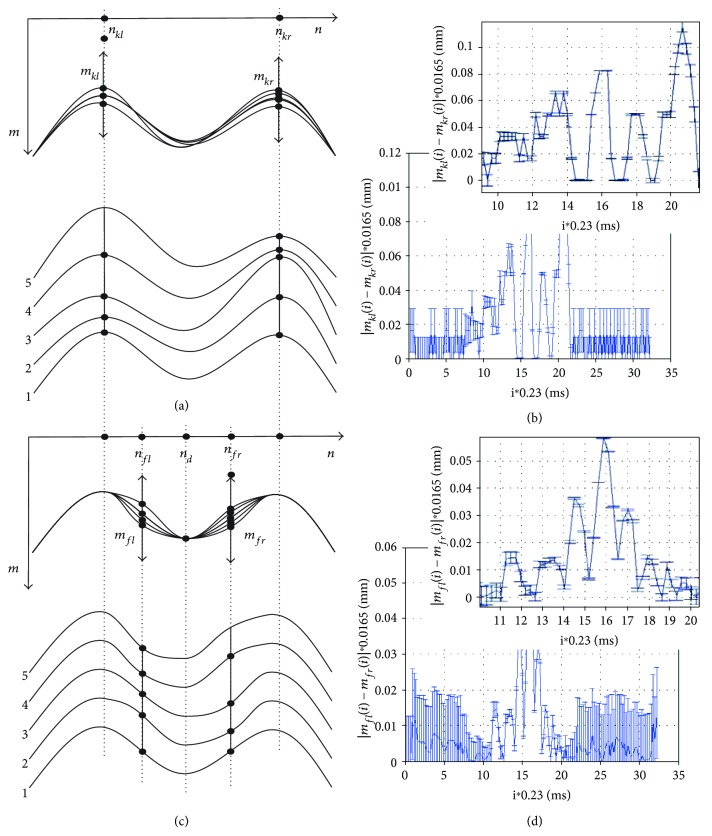
Figure 3.
Diagram and results of peak vibration and quarter vibration calculations. (a, c) Schematic diagrams of calculating the peak vibration and quarter vibration and (b, d) examples of the results together with their magnification and measurement error δ, respectively. For the analysed case, Ap1 = 10 ms and Ap2 = 21 ms.

