Figure 9.

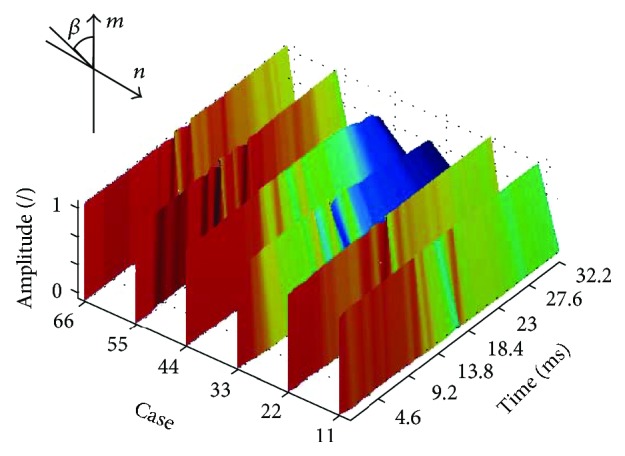
Changes in the angle β(i) for the quarter vibration for the first six patients (normalized amplitude). The graph is shown for the artificial colour palette.

Changes in the angle β(i) for the quarter vibration for the first six patients (normalized amplitude). The graph is shown for the artificial colour palette.