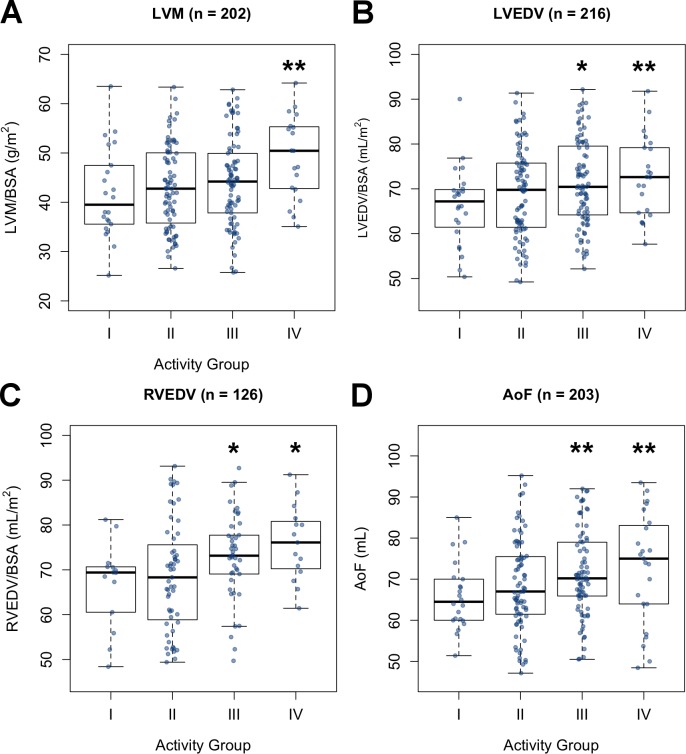
Fig 3. Relationship between wearable-derived physical activity and cardiac parameters.
Distribution of (A) LVM, (B) LVEDV, (C) RVEDV, and (D) AoF values across the 4 activity categories (Cat I–Cat IV). The code to generate this figure can be found in S2 Data. Asterisks denote significance of activity category as a GLM predictor with reference to Cat I. * = p < 0.05; ** = p < 0.01. AoF, aortic forward flow; BSA, body surface area; GLM, generalized linear model; LVEDV, left ventricular end-diastolic volume; LVM, left ventricular mass; RVEDV, right ventricular end-diastolic volume.

