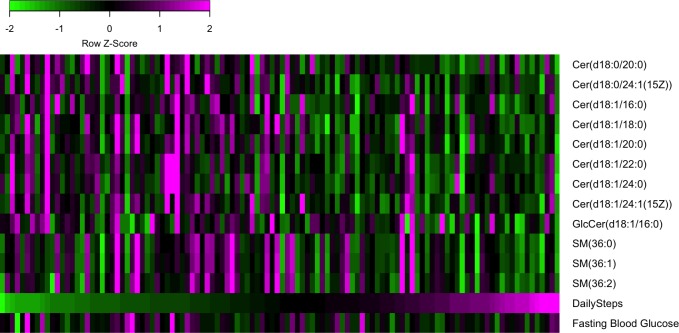
Fig 4. Wearable-derived activity and sphingolipid abundance.
Heatmap showing the abundance of sphingolipids that are significantly associated with DailySteps. Columns represent volunteers ordered by increasing DailySteps. For comparison, values of FBG and DailySteps are shown. All values are z-score normalized by row. The code to generate this figure can be found in S2 Data. Cer, ceramide; DailySteps, average daily steps; FBG, fasting blood glucose; GlcCer, glucosylceramide; SM, sphingomyelin.

