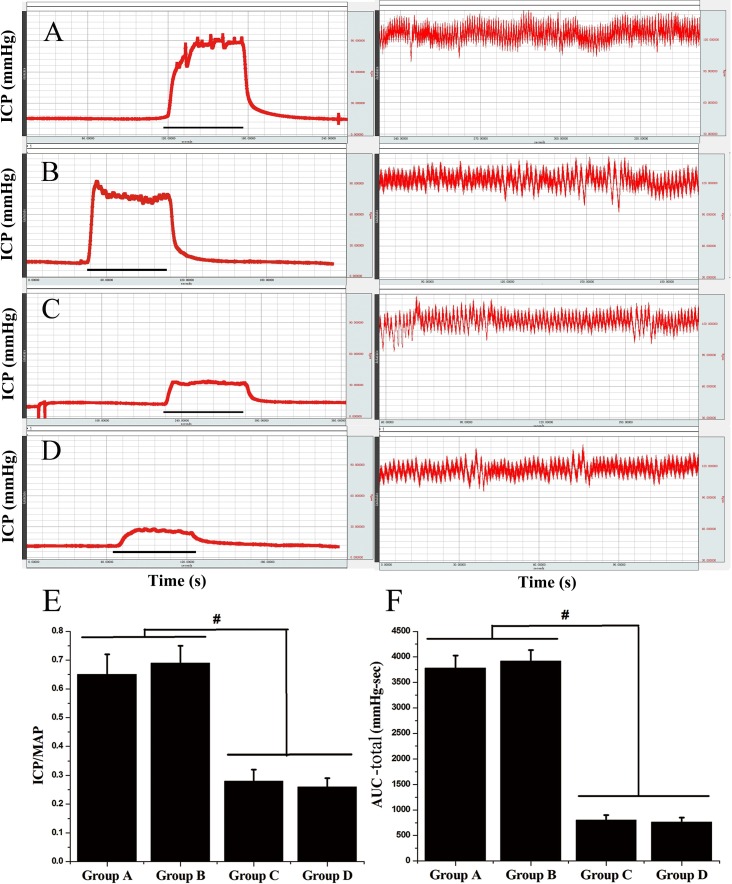
Fig 5. Changes of ICP, MAP, ICP/MAP and the area under the curve (AUC) of each group.
(A-D): Biopac physiograph displayed the ICP (left) and MAP (right) of representative rats in Group A-D. The x-axis depicted seconds and the horizontal bar represented one electrical stimulus lasting 60 seconds. The Y-axis represented changes in ICP or MAP. (E, F): Statistical chart of ICP/MAP ratio and total AUC in each group (n = 8, 10, 6, 10, respectively). Bar graphs represent means±SD, #P <0.01. Group A = intact rats under the method of cannulation into the crus of the penis; Group B = intact rats cannulating into the penile shaft; Group C = castrated rats with penile crus cannulation; Group D = castrated rats with penile shaft cannulation.

