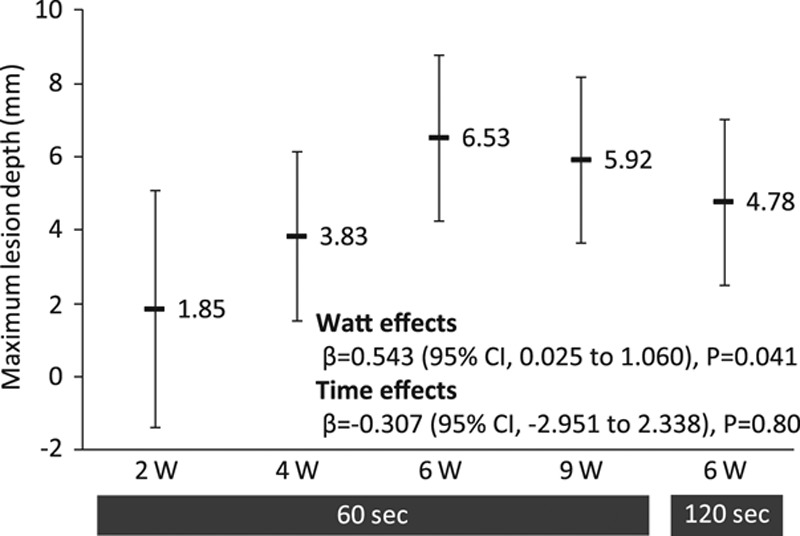
Figure 4.

Maximum lesion depth averaged among multiple lesions at each ablation setting. The estimated mean values with 95% CI and the regression coefficients (β) with their P values are shown in the plots. The mixed-effects model was used. CI indicates confidence interval.
