
Figure 4.
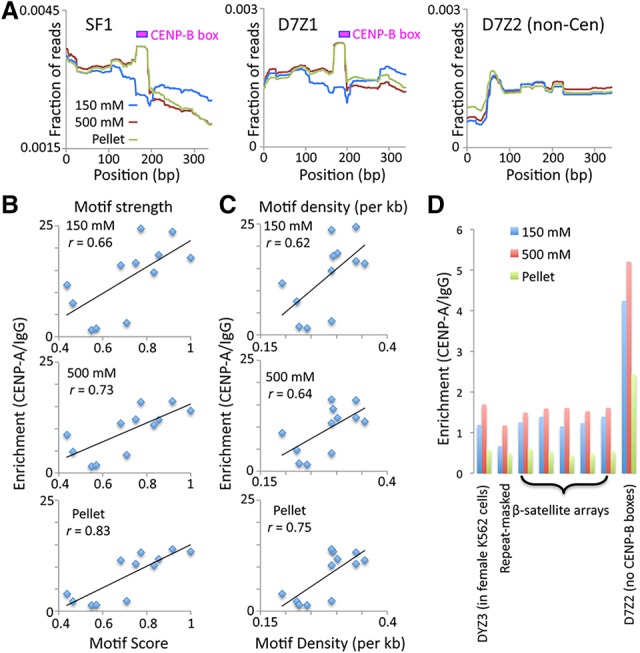
CENP-B stabilizes CENP-A/B/C. CUT&RUN was performed using permeabilized cells (Skene and Henikoff 2017a). (A) Mapping of CENP-B CUT&RUN.Salt to SF1, D7Z1, and D7Z2 sequences. To avoid edge effects, paired-end 25-bp × 25-bp reads were mapped to a tandemly triplicated 340-bp dimer consensus sequence representing each contig. The average occupancy over the middle dimer is shown. (B) Correlation between CENP-B box motif score (where 1 indicates identity to the central 15 bp of the CENP-B box, and 0 indicates more than three mismatches) and CENP-A/IgG fold enrichment values in CUT&RUN.Salt fractions. The average of two experiments (10-min and 30-min digestion times) is shown. (C) Same as B for motif density per kilobase. (D) CENP-A CUT&RUN.Salt fold enrichments are shown for a Y-chromosome α satellite (DYZ3) that is absent from the female K562 cells used in this experiment, the repeat masked Hg19 genome, annotated β satellites, and α satellites from a homogeneous array (D7Z2) that lacks CENP-B boxes. Data are from 250-bp × 250-bp mapped merged pairs.