
Table 6.
Results for studies reporting percentage reduction in excess arm volume
| Study | Duration of intervention (weeks) | Number of participants (n) | Measurement method | Mean % EAV reduction post-intervention | Mean %EAV reduction at week 4–7 | Mean %EAV reduction at 3 months | Mean %EAV reduction at 6 months | Mean %EAV reduction at 1 year |
| Complex decongestive treatment (CDT/DLT) | ||||||||
| Dayes et al. 201335,bDLT groupcControl groupc | 4 | 3123 | Manual circumference | 28 ± 47e42 ± 57e | 29 ± 45e28 ± 25e | 36 ± 35e38 ± 46e | 45 ± 35e38 ± 34e | 36 ± 64e37 ± 51e |
| Gradalski et al. 201582CDT groupdCB group | 2 | 25‡ | Manual circumference | Reported: 47% relative volume change87,f‡ | ||||
| Haghighat et al. 201375,bCDT groupc | 2–3 | 60 | Water displacement | 46 ± 13g | - | - | - | - |
| Compression bandaging (CB) and manual lymph drainage (MLD) | ||||||||
| McNeely et al. 200436 ‡CB+MLD groupcCB groupc | 4 | 810 | Water displacement | 56‡ g,h47‡ g,h | ||||
| 810 | Manual circumference | 62‡ g,h44‡ g,h | ||||||
EAV = excess arm volume.
‡aPercentage reduction in EAV calculated as 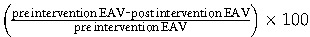 .
.
bData provided by corresponding author.
cSubgroup of women with BCRL duration <12months.
dMean BCRL duration ≤9 months.
ep > .05 within group difference.
fp < .05 within group difference.
gNo p values reported.
hData calculated from published graph.
‡Data not presented: mean BCRL duration >9 months.