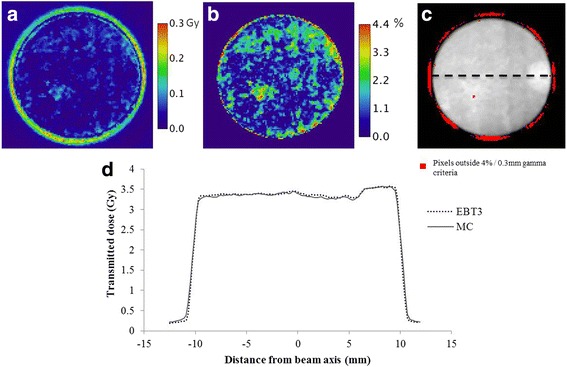
Fig. 6.

a Absorbed dose difference (Gy) between EBT3 and MC results. b Relative dose difference (%) between EBT3 and MC results performed inside the 80% isodose area. c Gamma analysis performed with 4% DD and 0.3 mm DTA, revealing a success rate of 94.9%. d Measured and calculated horizontal dose profiles along a diameter plotted with the dashed line on (c)
