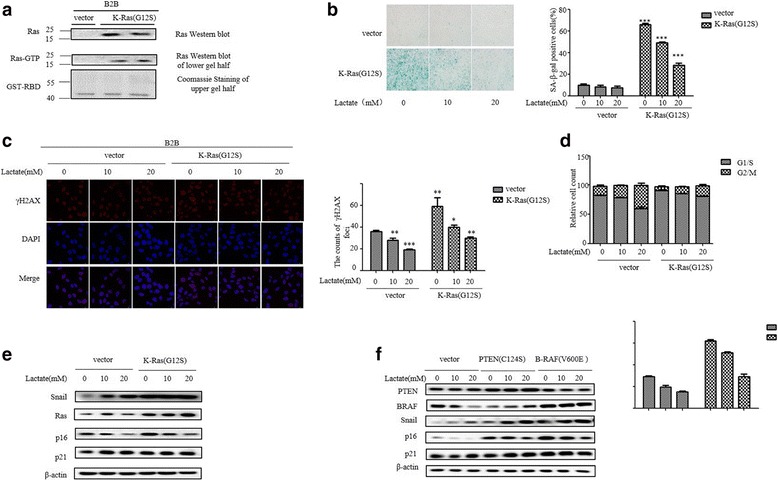
Fig. 4.

Effect of lactate on oncogene-induced senescence in human lung epithelial cells. a K-Ras activity was analyzed by using Ras Assay Kit according to the manufacturer’s instructions at day 3 after infection with K-Ras (G12S) and vector. Ras represents total Ras, Ras-GTP represents active Ras. b SA-β-gal activity were analyzed at day 3 after infection of B2B cells with K-Ras (G12S) construct or vector with indicated lactate treatment. The percentage of SA-β-gal positive cells is presented in the right histogram. The bars represent the mean ± s.d. of triplicates. *P < 0.05, **P < 0.01, ***P < 0.001. c γH2AX positive cells was analyzed with fluorescence microscopy at day 3 after infection of B2B cells with K-Ras (G12S) construct and then treatment with lactate (0, 10, 20 mM) for 3 h. d Cell cycle analysis was performed at day 3 after infection of K-Ras (G12S) and then treatment with lactate (0, 10, 20 mM) for 3 h. The percentage of G1/S and G2/M phase cells was quantified based on the content of DNA and the data are demonstrated as shown. e Representative Western blot analysis of Snail, p16INK4a, p21CIP-1 and Ras in B2B cells transfected with K-Ras (G12S) and vector at 72 h after transfection and different concentrations treatment of Lactate for 3 h. f Transfection of B2B cells with PTEN (C124S) and B-RAF (V600E) for 72 h then treated with different concentrations Lactate for 3 h were analyzed by immunoblotting of the expression levels of Snail, p16INK4a, and p21CIP-1
