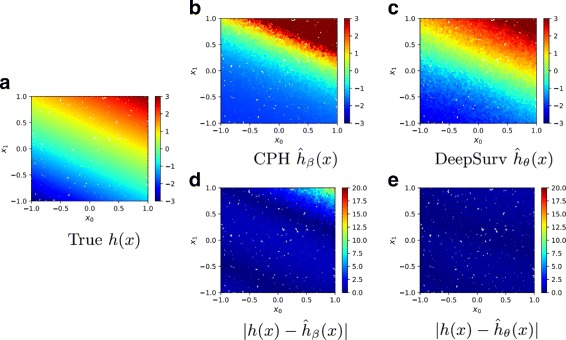
Fig. 2.

Simulated Linear Experimental Log-Risk Surfaces. Predicted log-risk surfaces and errors for the simulated survival data with linear log-risk function with respect to a patient’s covariates x0 and x1. a The true log-risk h(x)=x0+2x1 for each patient. b The predicted log-risk surface of from the linear CPH model parameterized by β. c The output of DeepSurv predicts a patient’s log-risk. d The absolute error between true log-risk h(x) and CPH’s predicted log-risk . e The absolute error between true log-risk h(x) and DeepSurv’s predicted log-risk
