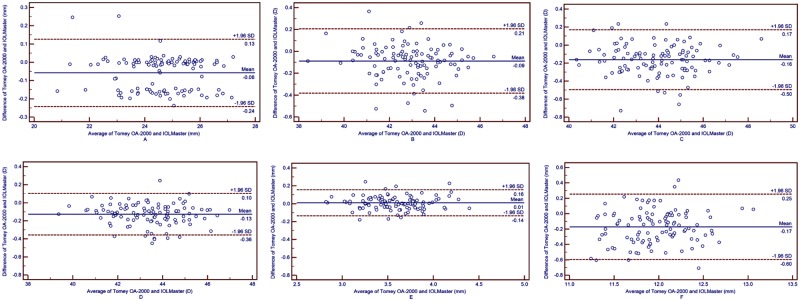
Fig 1. Bland-Altman plots present the mean plotted against the differences in values of AL (A), Kf (B), Ks (C), Km (D), ACD (E) and CD (F) for a comparison between the Toomey OA-2000 biometer and IOLMaster.
The solid line indicates the mean difference. The interval between upper and lower lines represent the 95% LoA.

