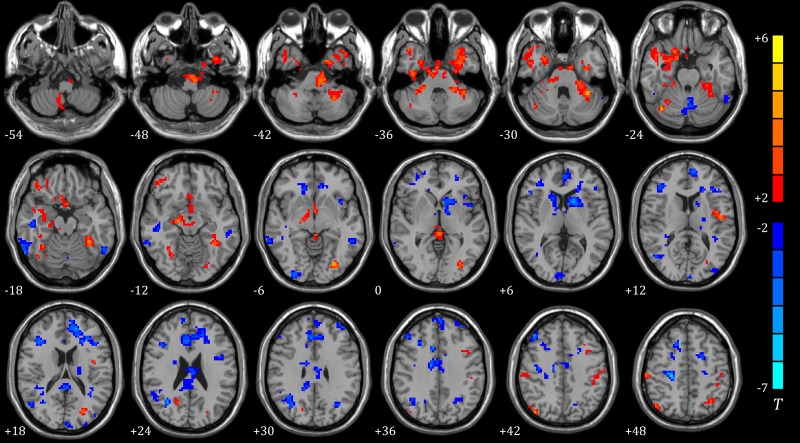
Fig 3. ReHo of different brain regions between sleep (N = 11) and m-PIS (N = 12) (two sample t-test, P<0.01, cluster size>19).
The blue regions represent significantly increased ReHo values and red regions represented significantly decreased ReHo values in m-PIS state compared to sleep state. Color indicates t values.

