
Fig 5. Differences in the FC maps based on three ROIs between sleep (N = 11) and m/d-PIS (N = 12) (P<0.01, cluster size>19).
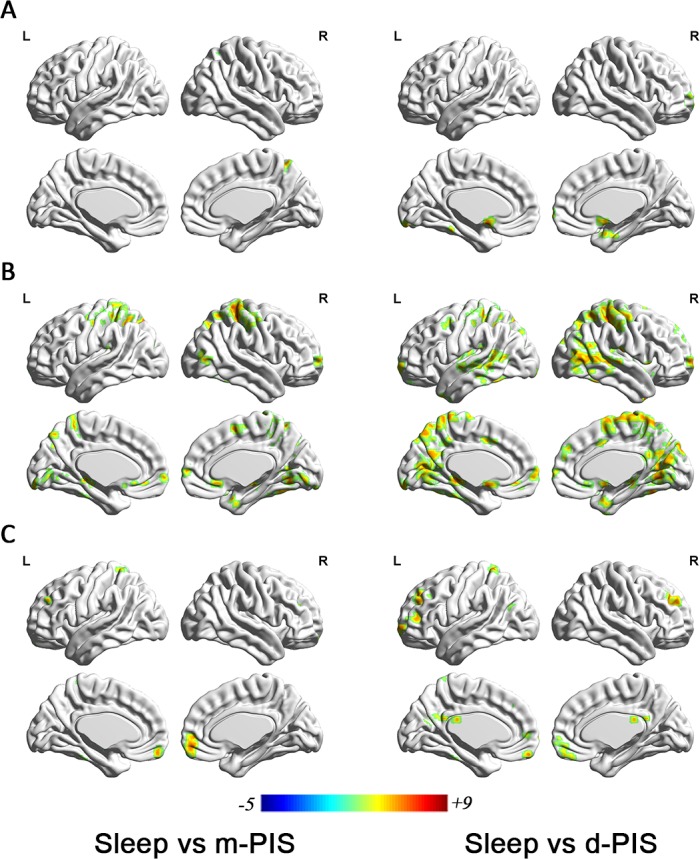
A showing significantly differences in the FC map based on brainstem between sleep and m-PIS (left) /d-PIS (right); B showing significantly differences in the FC map based on cerebellum between sleep and m-PIS (left) /d-PIS (right); C showing significantly differences in the FC map based on thalamus between sleep and m-PIS (left) /d-PIS (right). Blue regions represent significantly increased FC values and red regions represent significantly decreased FC values in m/d-PIS state compared to sleep state. Color indicates t values.