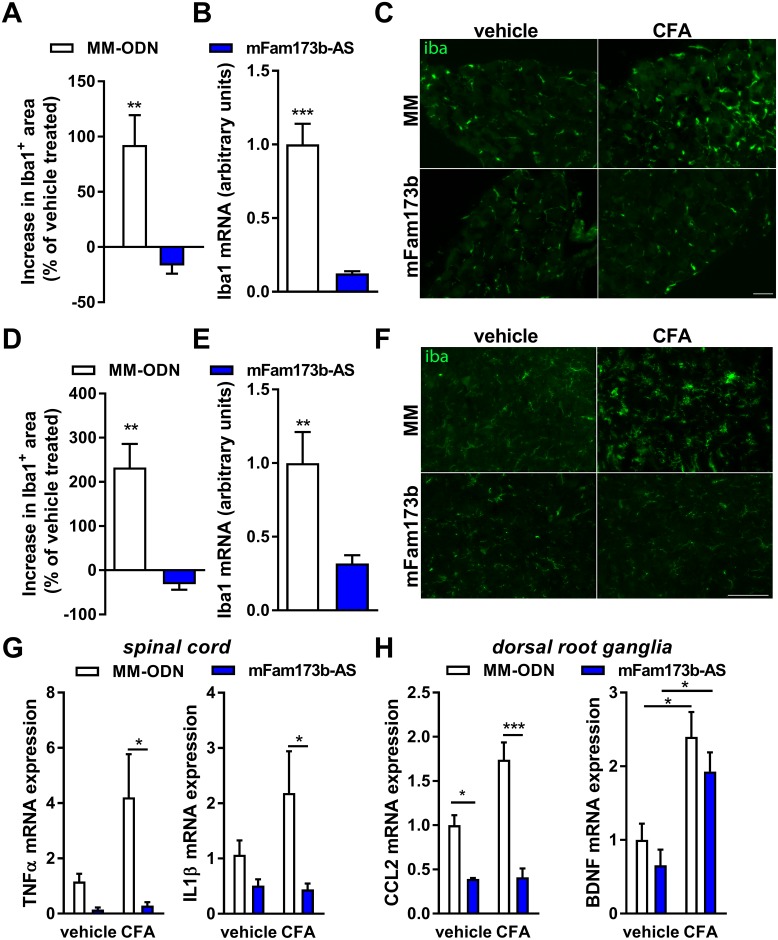
Fig 7. FAM173B knockdown prevents microglia activation.
(A–H) Mice received intraplantar CFA to induce persistent hyperalgesia and received intrathecal mFam173b-AS to knockdown mFam173b or MM-ODN as control at day 5, 6, 7, 9, and 10. At day 11 after CFA injection, microglia activation in (A–C) DRG and (D–F) spinal cord was assessed by analysis of (A, D) fluorescent Iba1-positive area (n = 4 mice) and (B, E) Iba1 mRNA (n = 8 mice) in the dorsal horn of spinal cord or DRG. (C, F) Exemplar images of Iba1 staining of (C) DRG and (F) spinal cord as quantified in A and D. Scale bars 50 μm. The specific area quantified in the spinal cord is shown in S4D Fig. (G, H) Inflammatory mediator mRNA expression 24 hours after the last intrathecal injection of mFam173b-AS to knockdown mFam173b (day 11 after CFA) in (G) spinal cord and (H) DRG (n = 8 mice). Data are represented as mean ± SEM. * = P < 0.05; ** = P < 0.01; *** = P < 0.001. Statistical analyses were performed by unpaired two-tailed t tests ([A, B], [D, E]), by one-way ANOVA (G/H) followed by a post-hoc Holm-Sidak multiple comparison test. Underlying data can be found in S1 Data. CFA, complete Freund’s adjuvant; DRG, dorsal root ganglia; Iba1, ionized calcium binding adaptor molecule 1; MM-ODN, mismatch ODN; ODN, oligodeoxynucleotide; SEM, standard error of the mean.

