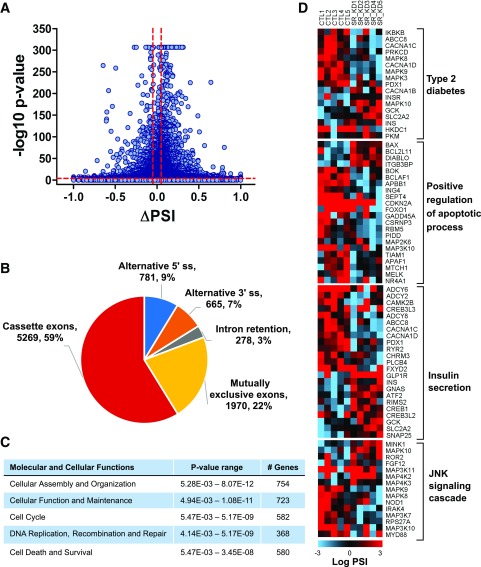
Figure 2.
RNA sequencing of EndoC-βH1 cells after SRp55 depletion. A: Pairwise comparison of control vs. SRp55 KD EndoC-βH1 cassette exons shown as a volcano plot. AS events presenting a difference of ΔPSI >5% and an FDR ≤0.01% were considered modified, as indicated by the dotted lines. B: Numbers and proportions of the different AS events modified after SRp55 silencing, as identified by rMATS analysis. C: Ingenuity pathway analysis of genes showing differential AS (enhanced or inhibited) after SRp55 depletion. D: Heat maps showing genes enriched with Gene Ontology terms involved in cell survival and β-cell function. PSI values are represented by gradient colors and shown for each individual control and SRp55 KD sample. Red represents a higher PSI; blue represents a lower PSI. Results are based on five RNA sequencing samples.

