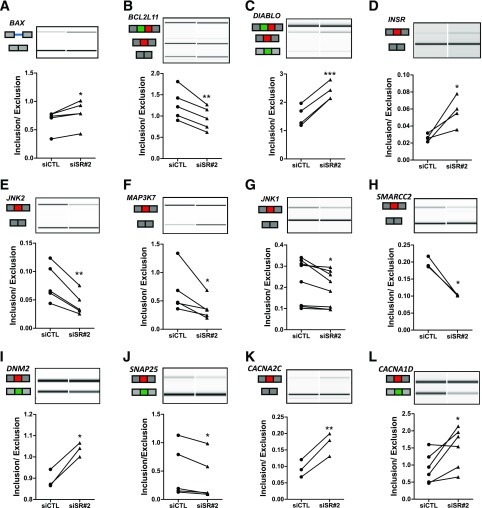
Figure 3.
Confirmation of SRp55-regulated splicing events shown through representative RT-PCR validations (A–L). cDNA were amplified by RT-PCR using primers located in the upstream and downstream exons of the modified splicing event. PCR fragments were analyzed by automated electrophoresis using a bioanalyzer machine and quantified by comparison with a loading control. For each gene, representative gel images showing different splice variants affected by SRp55 KD and the corresponding inclusion-to-exclusion ratios are shown. The structure of each isoform is indicated by exons (blocks) and introns (solid lines). Alternatively spliced regions are indicated in red, green, or blue. Results are the mean ± SEM of three to eight independent experiments. *P < 0.05, **P < 0.01, and ***P < 0.001 vs. siCTL (paired t test).

