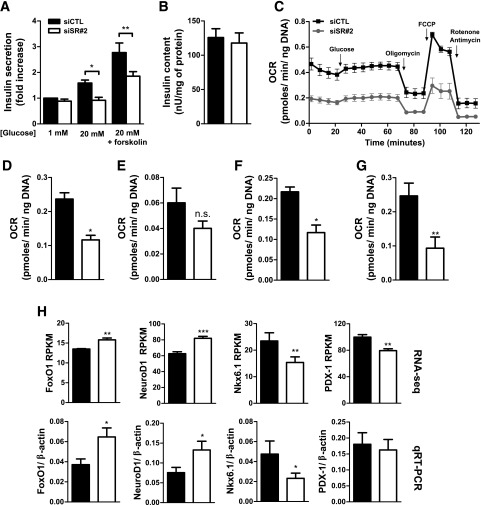
Figure 4.
SRp55 depletion impairs insulin secretion and mitochondrial respiration. A: Insulin secretion in EndoC-βH1 cells was evaluated by ELISA after 1 h of stimulation with 1 mmol/L glucose, 20 mmol/L glucose, or 20 mmol/L glucose plus forskolin. A, B, and D–H: Black bars indicate transfection with control siRNA and white bars indicate transfection with siRNA against SRp55. B: Insulin content after SRp55 KD was evaluated by ELISA. C–G: Analysis of mitochondrial respiration parameters in EndoC-βH1 cells using a Seahorse oximeter. C: Oxygen consumption rate (OCR) profiles of control and SRp55 KD cells at basal conditions (1 mmol/L glucose) and after sequential treatment with glucose (20 mmol/L), oligomycin (5 μmol/L), FCCP (4 μmol/L), and rotenone plus antimycin A (1 μmol/L each). Injection of different compounds is indicated by arrows. D: Basal respiration (1 mmol/L glucose), calculated by subtracting nonmitochondrial respiration from the last measurement before 20 mmol/L glucose injection. E: Response to high glucose, calculated by subtracting the last basal respiration measurement from the last measurement after injection of 20 mmol/L glucose. F: ATP production, calculated by subtracting the minimum measurement after oligomycin injection from the last measurement after glucose injection. G: Maximal respiration, calculated by subtracting nonmitochondrial respiration from the maximum measurement after FCCP injection. H: mRNA expression of transcription factors regulating β-cell identity and phenotype. In the top panels, RNA sequencing expression values are shown in RPKM, and in the bottom panels, confirmation is indicated by quantitative RT-PCR (qRT-PCR) normalized by the housekeeping gene β-actin. Results are the mean ± SEM of three to nine experiments. *P < 0.05, **P < 0.01, and ***P < 0.001 vs. siCTL (ANOVA followed by the Bonferroni post hoc test [A] or the paired t test [B and D–H]).

