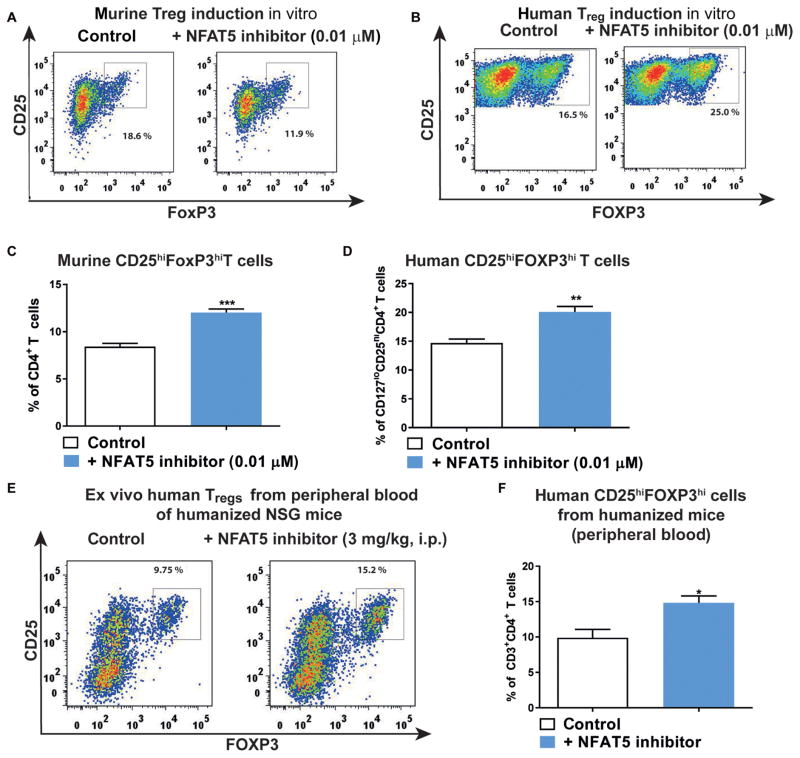
Fig. 6. A NFAT5 inhibitor increases Treg induction.
(A and B) Representative FACS plots indicating CD4+CD25+FoxP3+ Tregs upon murine (A) or human (B) Treg induction with subimmunogenic TCR stimulation and IL-2 (100 U/ml) using naïve CD4+ T cells with or without NFAT5 inhibitor (0.01 μM). (C and D) Frequencies of CD4+CD25+FoxP3+ Tregs upon Treg induction as in (A) and (B) (n = 5 experiments). (E) Representative FACS plots indicating ex vivo CD4+CD25+FOXP3hi Tregs in peripheral blood of humanized NSG mice after treatment with either saline or a specific NFAT5 inhibitor [3 mg/kg, intraperitoneally (i.p.)] for 4 days. (F) Frequencies of CD4+CD25+FOXP3hi Tregs as in (E) (n = 5 per group). Data are means ± SEM (C, D, and F). *P < 0.05, **P < 0.01, and ***P < 0.001, Student’s t test.

