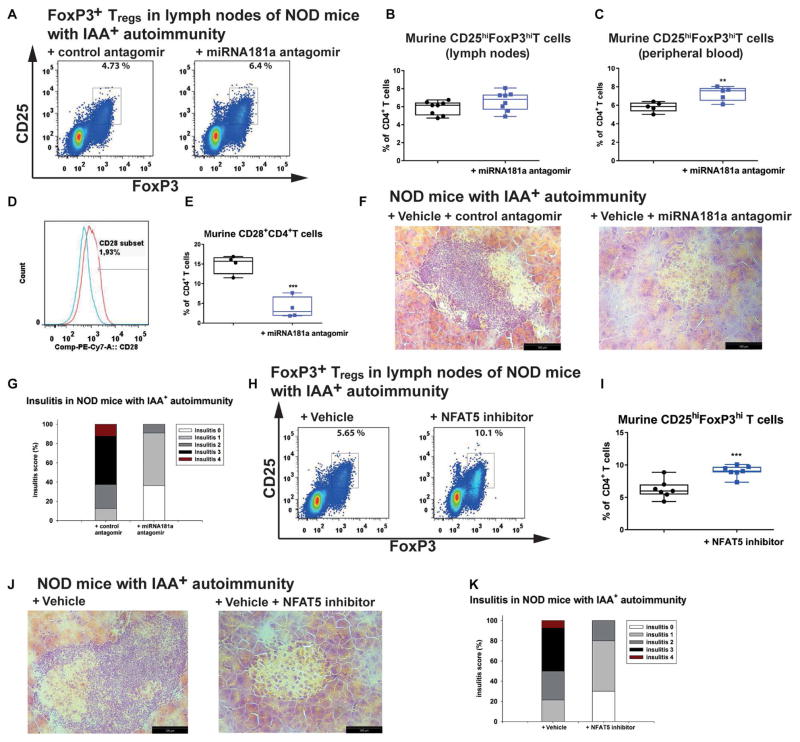
Fig. 7. NFAT5 or miR181a inhibition in vivo improves islet autoimmunity.
(A) Representative FACS plots indicating ex vivo CD4+CD25+FoxP3+ Tregs from the lymph nodes of IAA+NOD mice treated with an miRNA181a or control antagomir for 14 days with 10 mg/kg ip every other day. (B) Summary graphs for CD4+CD25+FoxP3hi Tregs as in (A) (n = 8 per group). (C) Frequencies of ex vivo CD4+CD25+FoxP3hi Tregs from peripheral blood of IAA+NOD mice treated as in (A) (n = 5 per group). (D) Representative histogram of CD28 staining in ex vivo CD4+ T cells from IAA+NOD mice treated with a control antagomir (red) or miRNA181a antagomir (blue). (E) Summary graph for CD28+ T cells as in (D) (n = 4 per group). (F) Representative hematoxylin and eosin–stained pancreas cryosections from IAA+NOD mice treated as in (A) (n = 5 mice per group/3 sections per mouse; scale bars, 100 μm). (G) Grading of insulitis from mice as in (F) (n = 5 per group). (H) Representative FACS plots indicating ex vivo CD4+CD25+FoxP3+ Tregs from the lymph nodes of IAA+NOD mice treated with an NFAT5 inhibitor or vehicle control for 14 days with 3 mg/kg ip every day. (I) Summary graphs for CD4+CD25+FoxP3hi Tregs as in (H) (n = 7 per group). (J) Representative hematoxylin and eosin–stained pancreas cryosections from IAA+NOD mice treated as in (H) (n = 5 mice per group/3 sections per mouse; scale bars, 100 μm). (K) Grading of insulitis from mice as in (J) (n = 5 per group). Data are presented as box and whisker plots with minimum to maximum values for data distribution. **P < 0.01 and ***P < 0.001, Student’s t test.

