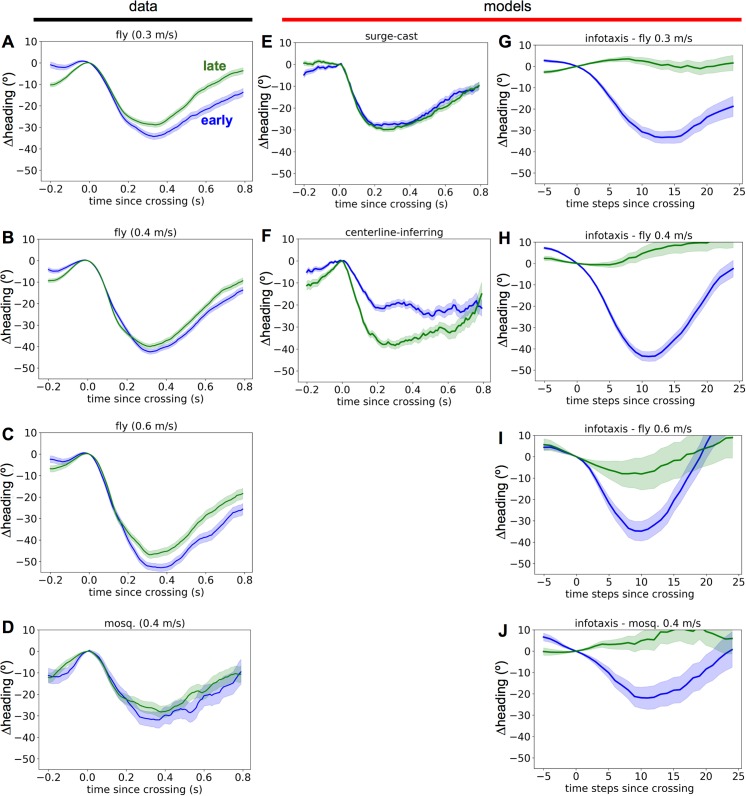
Fig 3. History dependence of crossing-triggered turns in data and models.
A-D. Crossing-triggered heading time courses for early (blue) or late (green) crossings for fruit flies tracking an ethanol plume in three different wind speeds, or mosquitoes flying in a wind tunnel with a 0.4 m/s wind. Thick lines indicate means, with shading indicating standard error of the mean. E. Same as A but for trajectories generated using the surge-cast model. F. Same as A but for trajectories generated using the centerline-inferring model. G-J. Same as A-D but for trajectories generated using the infotaxis algorithm, with wind speeds and plume profiles matched to each of the four experiments.

