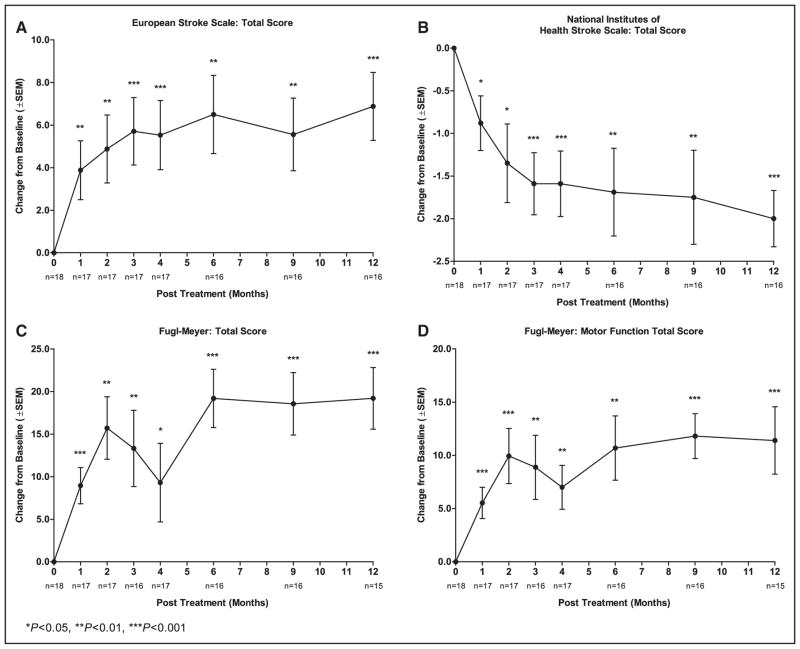
Figure 1.
A–D, Change of clinical outcome end points from baseline for pooled SB623 cells at 12 months (intent-to-treat population, n=18). (A) European Stroke Scale. (B) National Institutes of Health Stroke Scale. (C) Fugl-Meyer (F-M) total score. (D) F-M motor function total score. Error bars represent SEM. P values represent significance of change vs baseline using the Wilcoxon signed-rank test (P<0.05), which were not corrected for multiplicity.

