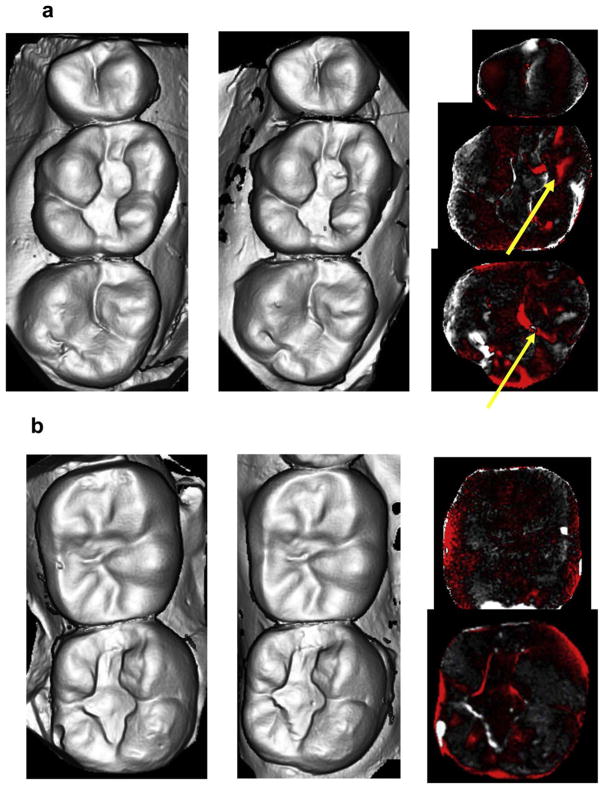
Fig. 5.
(a) Scanned image of casts of antagonist enamel and control enamel at baseline (left), one year (middle) and superimposed image showing wear areas in red (right); (b) Scanned image of casts from the same patient of crowned tooth and antagonist enamel at baseline (left), one year (middle) and superimposed image showing wear areas in red (right). (For interpretation of the references to colour in this figure legend, the reader is referred to the web version of this article.)

