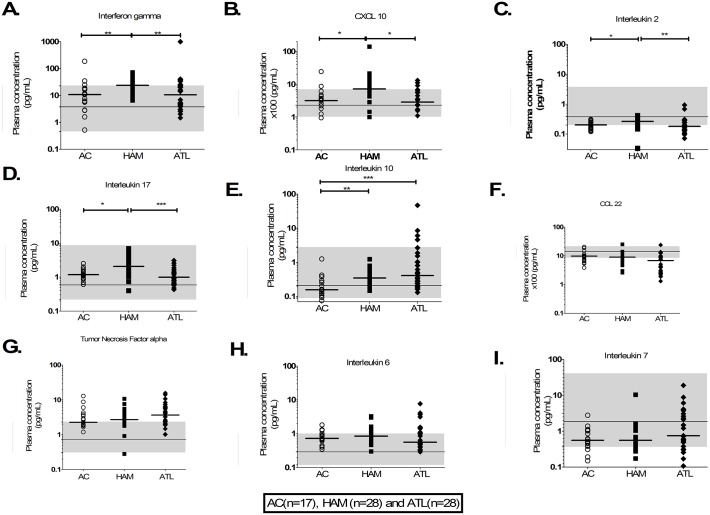
Fig 1. Plasma cytokine concentration in non-ATL HTLV-1 infection and ATL.
A-I) Aligned column plots of plasma cytokine/chemokine concentrations in patients with non-ATL HTLV-1 infection and ATL. The bar represents median values. The continuous line and shaded area shows manufacturer supplied median and range in healthy individuals. Statistical analysis: Kruskal-Wallis test with Dunn post-test, 95% confidence interval. * denotes p<0.05, ** denotes p<0.01, *** denotes p<0.001.

