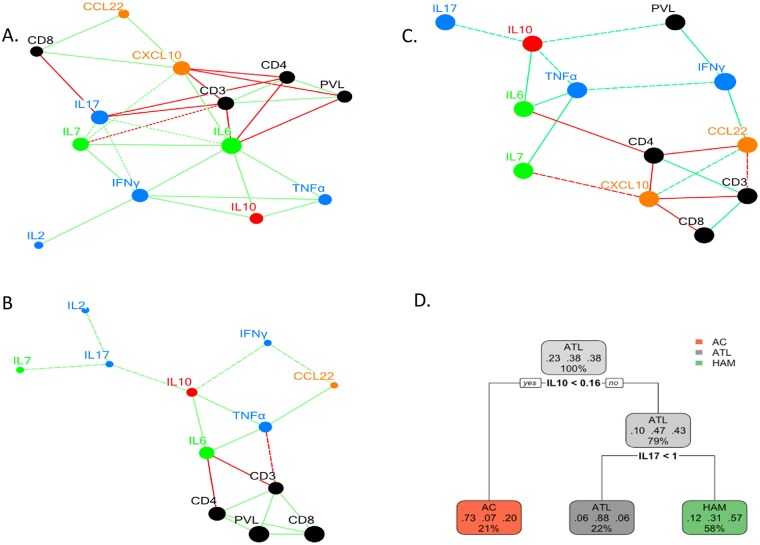
Fig 3. Network and classification tree analysis of plasma cytokine concentration in non-ATL HTLV-1 infection and ATL.
Network analysis of absolute T-cell subset count, HTLV-1 PVL and plasma cytokine concentration using at least significant Spearman correlation trends is shown for patients with ATL (A), HAM (B) and AC (C). The green and red lines denote positive and negative correlations respectively. The continuous and broken line denote statistically significant and trend correlations. The prune classification tree to classify diagnosis of AC, HAM and ATL on the basis of IL-10 and IL-17 concentration is shown in figure D. The percentage shows the distribution of all patients into different arms whilst the three decimal numbers shown specificity of each classification for diagnosis of AC, ATL and HAM respectively.

