
Figure 1. VHL is required for ILC2 development.
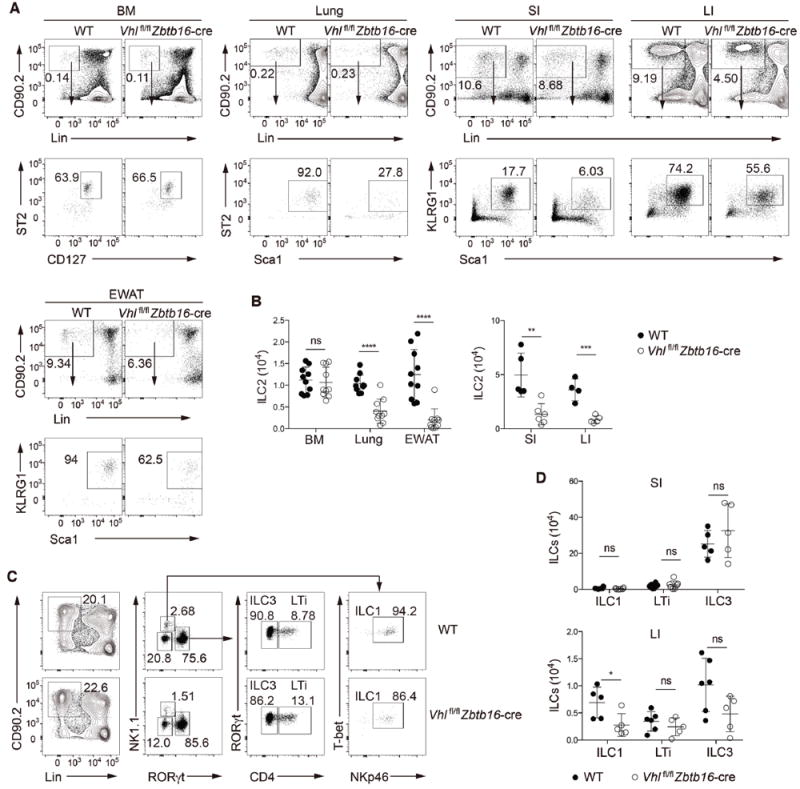
(A) Gating strategy and flow cytometric analysis of ILC2s from bone marrow (BM) and peripheral non-lymphoid tissues of wild-type (WT) and Vhlfl/fl Zbtb16-cre mice. BM ILC2s were identified as CD45+Lin−CD90.2+CD127+ST2+; lung ILC2s as CD45+Lin−CD90.2+Sca1hiST2+; and ILC2s from lamina propria of small intestine (SI) and large intestine (LI) and from epididymal white adipose tissue (EWAT) as CD45+Lin−CD90.2+Sca1hiKLRG1+. Lineage-negative gating (Lin) includes markers for CD3, CD5, CD4, CD8, TCRβ, TCRgγδ, NK1.1, CD11b, B220, TER119, Gr-1 and CD11c. Numbers indicate the frequency of flow cytometric events, arrows from outlined areas at top indicate gated cells analyzed below.
(B) Total numbers of ILC2s in the BM, lungs, EWAT, SI and LI of WT and Vhlfl/fl Zbtb16-cre mice (n = 4-10 per group).
(C) Gating strategy and flow cytometric analysis of different ILC subsets in LPLs from small intestine of WT and Vhlfl/fl Zbtb16-cre mice. ILC1s were identified as CD45+Lin−CD90.2+RORγt−NK1.1+T-bet+NKp46+, ILC3s as CD45+Lin−CD90.2+RORγt+CD4−, and LTi cells as CD45+Lin−CD90.2+RORγt+CD4+. Lin includes markers for CD3, CD5, CD8, TCRβ, TCRγδ, CD11b, B220, TER119, Gr-1 and CD11c. Numbers indicate the frequency of flow cytometric events, arrows from outlined areas at left indicate gated cells analyzed at right.
(D) Total numbers of ILC1s, LTi cells, and ILC3s from the SI (top) and LI (bottom) of WT and Vhlfl/fl Zbtb16-cre mice (n = 4-6 per group).
Each symbol (B,D) represents an individual mouse. Data are represented as mean ± SD. ns, not significant; *P < 0.05, **P < 0.01, ***P < 0.001, and ****P < 0.0001 (two-tailed unpaired t-test). Data are pooled from or representative of two to four independent experiments. See also Figure S1.