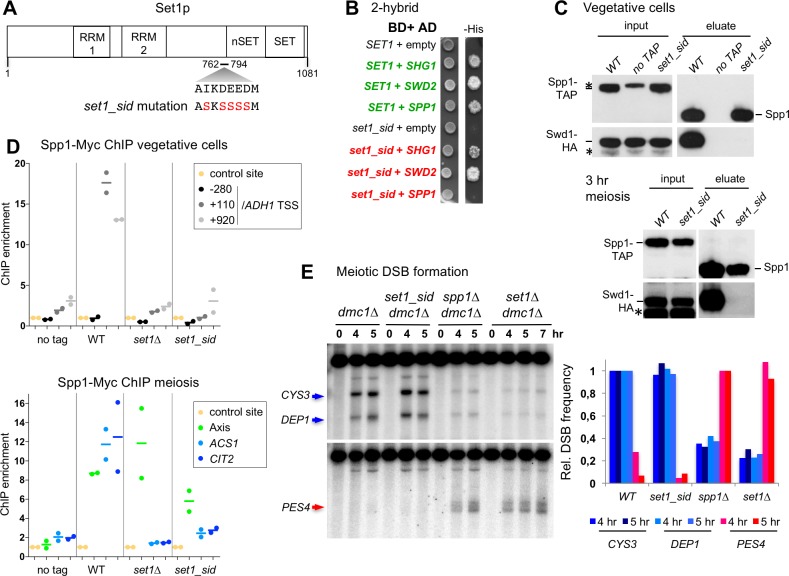
Fig 4. A mutant in an acidic patch of Set1 abolishes its interaction with Spp1 but does not affect meiotic DSB formation.
(A) Scheme of the Set1 protein domains, with the Spp1 interacting domain (762–794) [27], RRM1 and RRM2 RNA recognizing motifs [63], the SET catalytic and nSET regulatory domains [64] and the mutations creating the set1_sid mutant. (B) 2-hybrid assays for the interaction between Set1 and Spp1. Growth on the–His medium indicates an interaction between the two tested proteins. (C) Interaction of Spp1 with the Set1 complex subunit Swd1 in vegetative or meiotic cells examined by Western blot as indicated. Proteins pulled down by Spp1-TAP were released in the eluate after Tev cleavage of the TAP tag. Anti-HA and anti-TAP antibodies were used. The TAP antibody still recognizes the part of the tag left after Tev cleavage. SET1 SPP1-TAP SWD1-HA: VBD1745; SET1 SWD1-HA: VBD1742; set1_sid SPP1-TAP SWD1-HA: VBD1836. The asterisk indicates non-specific cross-hybridizing band. (D) Binding of Spp1 detected by ChIP-qPCR in vegetative cells or in meiotic cells at t = 3 hr. No tag: ORD7339; WT: VBD1187; set1∆: VBD1209; set1_sid: VBD1868. Each dot represents a biological replicate and the bar indicates the mean. (E) Meiotic DSB formation monitored in dmc1∆ cells by Southern blot at CYS3 and DEP1 DSB (upper panel), or at the spp1∆-specific PES4 DSB (lower panel). DSB sites are indicated by an arrow. WT: ORD7354; set1_sid: VBD1854; spp1∆: VBD1748; set1∆: ORD9624. Graph shows the DSB quantification relative to the level in WT (for CYS3, DEP1) or spp1∆ cells (for PES4 site). DSB were quantified at the 5 hr time point, with the additional 7 hr time point for set1∆.

