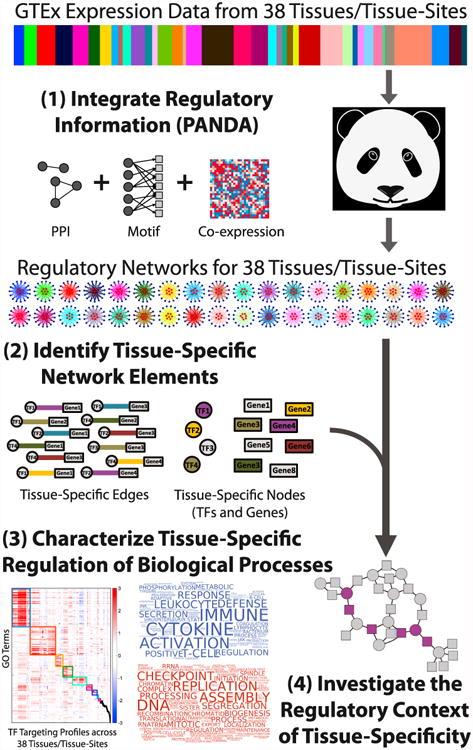
Figure 1. Schematic Overview of Our Approach.

We characterized tissue-specific gene regulation starting with GTEx gene expression data; the relative sample size of each of the 38 tissues in the expression data is shown in the color bar. We then used PANDA to integrate this information with protein-protein interaction (PPI) and transcription factor (TF) target information, producing 38 inferred gene regulatory networks, one for each tissue. We identified tissue-specific genes, transcription factors, and regulatory network edges, and we analyzed their properties within and across these networks.
