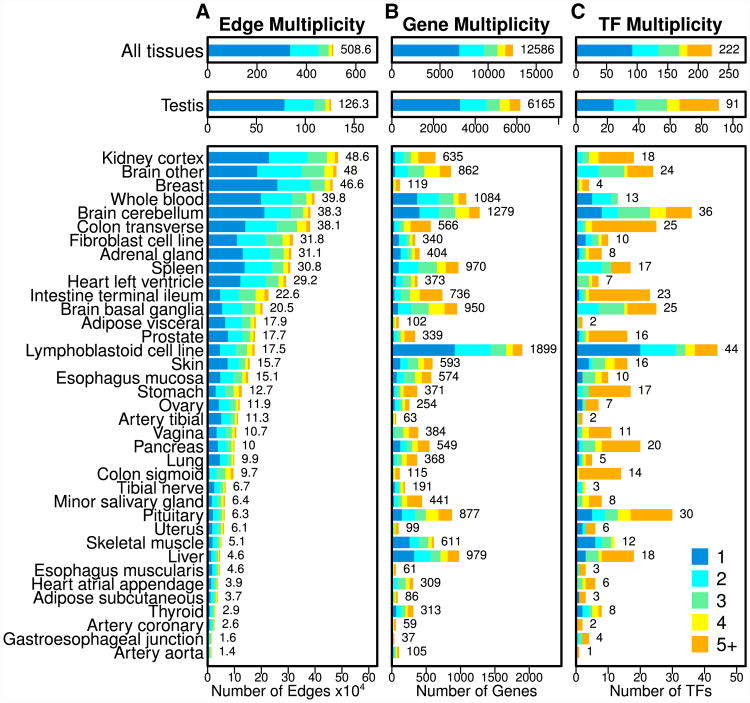
Figure 2. Tissue Specificity of Network Elements.
(A–C) Bar plots illustrating the number of edges (A), genes (B), and transcription factors (TFs) (C) that were identified as specific to each of the 38 GTEx tissues. The number of elements identified as specific in each tissue is shown to the right of each bar. The multiplicity of edges, genes, and TFs is indicated by the color of the bars. Note that an edge/gene/TF with a given multiplicity across all tissues (top bar plots) will appear in that number of tissue-specific bar plots (lower bar plots). See also Tables S1, S2, and S3 and Figures S1–S4.

