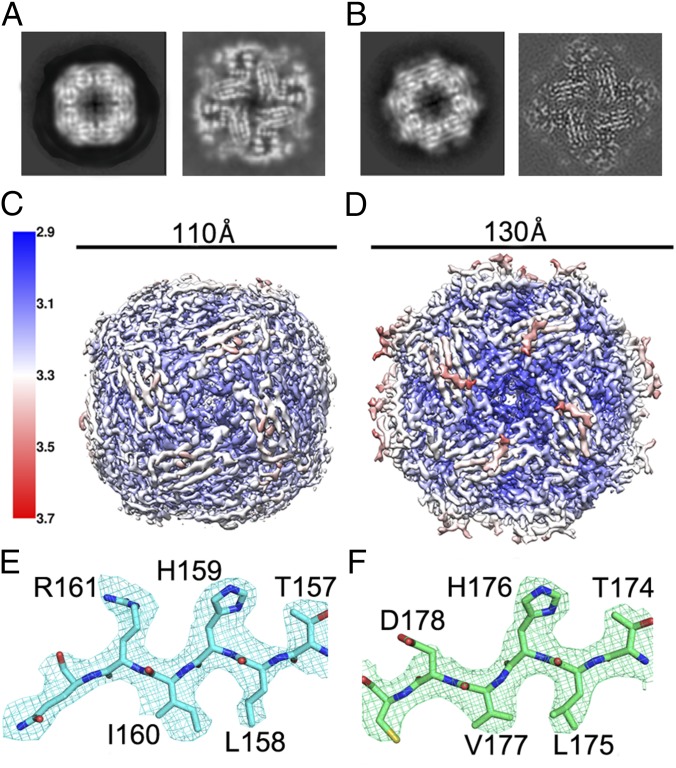
Fig. 1.
The cryo-EM structure of both At_IGPD and Sc_IGPD. Representative 2D class average (Left) and a slice through from the final 3D reconstruction showing the internal β-strands (Right) for At_IGPD (A) and Sc_IGPD (B). 3D reconstruction colored by local resolution (determined within RELION) for At_IGPD (C) and Sc_IGPD (D) (color key is shown on the right and approximate dimensions above). Example of the density in the EM maps for the equivalent region in At_IGPD (E; blue carbon atoms) and Sc_IGPD (F; green carbon atoms); note the different shape of the density for the Ile (At_IGPD) and Val (Sc_IGPD) residue. In E and F, nitrogen, oxygen, and sulfur atoms are colored blue, red, and yellow, respectively.

