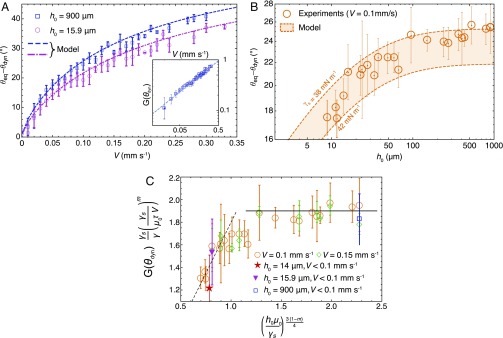
Fig. 3.
Characterization of the dynamics of the receding three-phase contact line on soft elastic layers. (A) Dependence of the contact angle difference on the velocity of the receding contact line on two layers of thickness and 900 m. Dashed lines: predictions based on our model. (A, Inset) Log–log plot of the function as a function of the contact-line velocity for the same systems. Dashed line: power-law fit with an exponent . (B) Dependence of on at constant receding velocity mms−1. Dashed lines: predictions of our model for two values of the solid surface tension . (C) Test of Eq. 11, relating the dynamic contact angle to the velocity of the contact line and the thickness of the sample in the small-thickness regime against experimental data. Dashed line: Eq. 11, with and a slope of 2. The horizontal line is a guide for the eyes.

