Fig. 2.
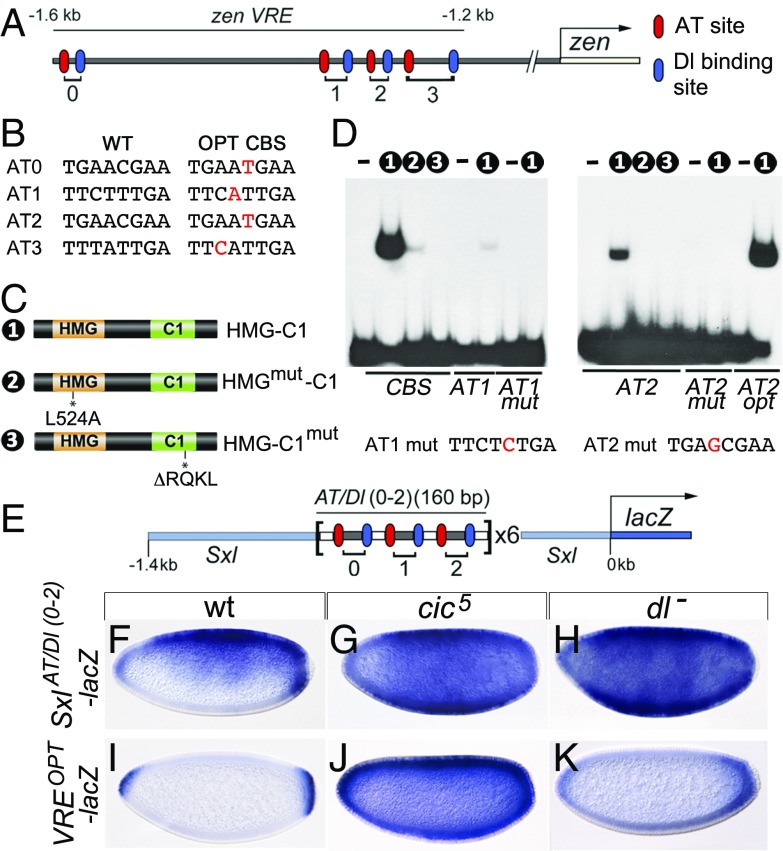
Cic represses VRE activity by binding to low-affinity DNA sites. (A) Diagram of the VRE indicating the positions of AT and Dl binding sites labeled according to refs. 14 and 15. In these and similar drawings, the transcription start site is indicated by an arrow. (B) Sequences of native (WT) AT sites and the corresponding optimal (OPT) CBSs. (C) Cic protein constructs used in EMSAs; the HMG-box and C1 domains are placed next to each other (20). HMG-C1mut contains the cic4 mutation (20). (D) EMSAs of Cic derivatives binding to WT or mutant probes. Numbers indicate the constructs used in the binding reactions; unlabeled lanes do not contain protein. Probes are indicated below the gels. CBS carries a control, high-affinity CBS. The sequence of the mutated AT1 mut and AT2 mut sites is also shown, with their respective substitutions indicated in red. Note the weak binding of HMG-C1 to the intact AT1 and AT2 probes. (E) Structure of the SxlAT/Dl(0-2)-lacZ reporter (not drawn to scale) (also Fig. S3). (F–K) Expression of SxlAT/Dl(0-2)-lacZ and VREOPT-lacZ reporters in the indicated backgrounds. Repression of SxlAT/Dl(0-2)-lacZ depends on both Cic and Dorsal, whereas Cic represses VREOPT-lacZ independently of Dorsal. Embryos in F–K were photographed at 200× magnification.

