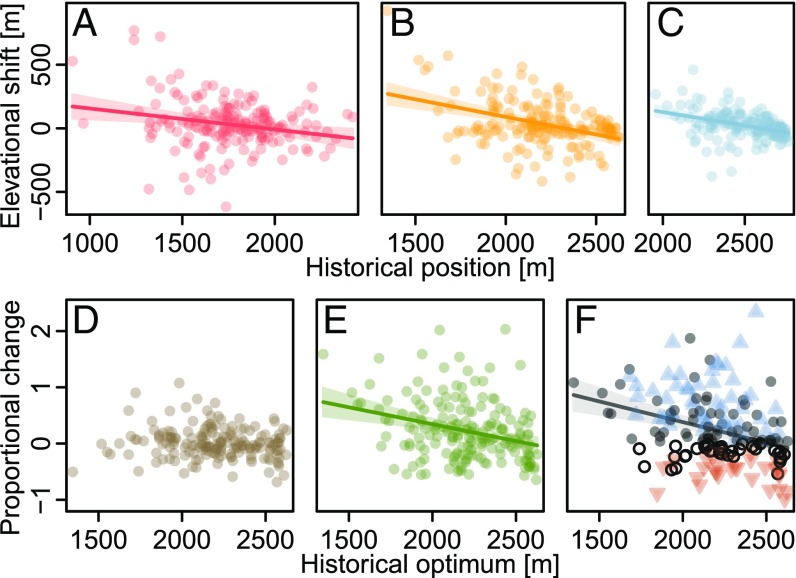
Fig. 3.
Relationships between changes of range attributes and the historical elevation of these attributes for 183 mountain plant species of the European Alps. (A) Rear edges, (B) optima, (C) leading edges, (D) elevational range size, (E) abundance, and (F) sum of proportional elevational range size and abundance changes. Lines and their shades represent significant linear regression models (Table S2) with their confidence intervals. In F, blue pyramids depict winners (i.e., species with increased elevational range sizes and increased abundances), red inverted pyramids depict losers (i.e., those with decreases in both of these range attributes), and dots symbolize species which combine loss in one attribute with gain in the other one. Closed darker dots can be considered as net winners (gain in one attribute > loss in the other one), and open dots can be considered as net losers (gain in one attribute < loss in the other one). Panels differ in size due to differing elevational ranges of the respective historical positions.

