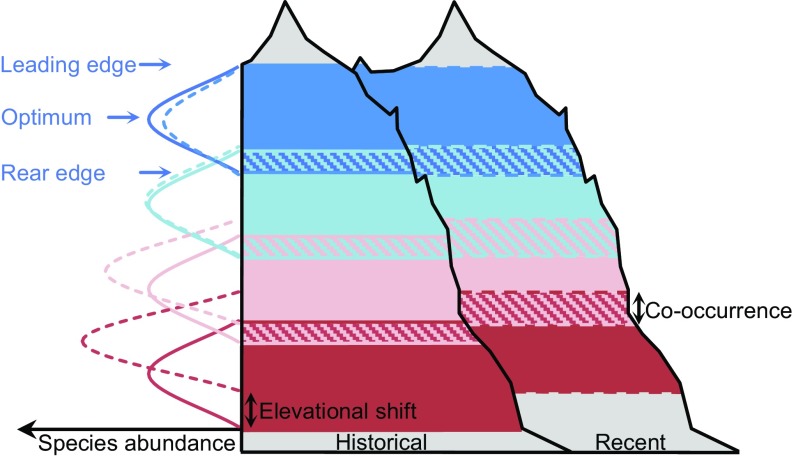
Fig. 6.
Schematic illustration of elevational range dynamics of four exemplary mountain plant species. Solid and dashed curves on the left represent historical and recent species distributions, respectively. Overlapping areas of two species indicate areas of cooccurrence. Note that elevational shifts of rear edges, optima, and leading edges as well as abundance changes decrease with elevation and that areas of cooccurrence increased at all elevations.

